Stop guessing. Design and automate SEO keyword ranking reports that connect search performance directly to business goals—forecasting traffic, capturing qualified leads, and driving revenue.
January 9, 2026 (9mo ago) — last updated September 15, 2026 (1mo ago)
Automated SEO Keyword Reports That Drive Revenue
Design and automate SEO keyword ranking reports that connect search performance to leads and revenue using high-impact keywords, KPIs, and automation.
← Back to blog
Build Automated SEO Keyword Ranking Reports That Drive Revenue
Summary: Design automated SEO keyword ranking reports that link search performance to leads and revenue by focusing on high-impact keywords, KPIs, and automation.
Introduction
Stop guessing. Learn to design and automate SEO keyword ranking reports that connect search performance directly to your business goals and revenue.
An effective SEO keyword ranking report isn’t just a list of positions. It’s a strategic tool that draws a clear line from SEO activity to business growth—forecasting traffic, generating qualified leads, and driving revenue. Move beyond vanity metrics and create reports that inform decisions and justify investment.
Moving Beyond Vanity Metrics in SEO Reporting
Too many SEO reports are vanity dashboards: long keyword lists with no link to business outcomes. Those reports don’t answer leadership’s real questions. A better report proves how ranking changes become leads and, ultimately, revenue.

There’s a reason the fight for top search positions is intense. The #1 organic result on Google captures a large share of clicks, so small rank moves can mean big traffic and conversion swings1. When marketers claim organic search delivers top ROI, leadership wants numbers that forecast traffic, leads, and closed deals—not just impressions or rank tables2.
Focus on High-Impact Keywords
Don’t chase thousands of low-value keywords. Focus on the smaller set that can actually grow the pipeline. Prioritize terms with commercial intent that match what you sell.
For example, a SaaS business will get more value from ranking for “enterprise accounting software demo” than for “what is accounting.” One phrase signals buying intent; the other signals general research.
“Transform your SEO keyword ranking reports from a passive summary into a strategic tool. It should prove the ROI of your efforts and justify further investment by showing a clear path from keyword to customer.”
Aligning Reports with Business Goals
Understand how visibility changes feed into outcomes. Your reports should answer the questions leadership actually asks:
- How is organic visibility contributing to new leads?
- Which content drives the most valuable traffic?
- What’s the forecasted ROI from our current SEO strategy?
Shift the conversation from “where do we rank?” to “how much revenue is SEO generating?” That is what makes reports invaluable.
Defining Goals and KPIs That Matter to Leadership
Before building a report, create a blueprint. Without one, reports are just noise. Leaders don’t care that a keyword moved from position 7 to 4; they care what that movement means for the bottom line.
A strong report tells a story that maps to the sales funnel. Replace vague goals like “increase traffic” with measurable KPIs tied to business outcomes. Instead of tracking ranks for “CRM software features,” track organic-driven demo requests or Marketing Qualified Leads (MQLs) from that topic cluster.
Connecting SEO KPIs to the Sales Funnel
Map KPIs to funnel stages:
- Top of Funnel (Awareness): Keyword visibility for informational searches, SERP feature ownership (featured snippets, People Also Ask), and organic impressions to show reach.
- Mid Funnel (Consideration): CTR from search results, pages per session, and time on page to show engagement.
- Bottom of Funnel (Decision): Organic-driven conversions—leads, demo sign-ups, form fills, or sales—to directly tie SEO to revenue.
Blend primary and secondary KPIs. Primary KPIs might be organic-driven leads; secondary KPIs like branded vs. non-branded traffic share provide context about brand strength.
Choosing the Right Metrics for Your Business
KPIs must match your business model. B2B SaaS teams focus on MQLs and demo sign-ups. Ecommerce teams focus on organic revenue and average order value. If you build interactive tools, track leads from those assets to show impact.
When comparing marketing costs, benchmark paid acquisition versus organic gains using a cost estimator such as the Facebook Ads Cost Estimator.
One-size-fits-all reports fail. CEOs, marketing managers, and content creators each need different views. Deliver the right information in the right format to the right person.
Designing Reports for Different Audiences
Reports should be audience-centric.
Tailoring Reports for the C-Suite
For executives, think “less is more.” They want the big picture: business impact, not daily keyword movements. Provide a clean, visual dashboard that answers pressing questions at a glance.
Focus on metrics that connect to revenue and market position:
- Organic ROI: Financial return on SEO investment.
- Market Share: Search visibility versus top competitors.
- Lead & Revenue Growth: Link organic traffic to new leads and sales.
Embed interactive tools to demonstrate value, for example the Digital Business Valuation Tool to estimate company value while capturing high-value leads.
Reports for Marketing and Content Teams
Marketing and content teams need granular, diagnostic data. Their reports should highlight:
- Campaign Performance: Keyword rankings for content clusters and initiatives.
- Content Effectiveness: Blog posts, landing pages, or tools driving the most valuable traffic.
- SERP Feature Ownership: Featured snippets, People Also Ask, and other search real estate wins.
Don’t just present data—translate it into actions. When rank drops happen, provide context such as competitor movement, content decay, or shifts in intent so teams can answer “Why did we drop?” and act quickly.
The SEO market is growing and content volume is exploding. To scale, teams need automated, well-structured reporting that surfaces the most important signals.
If you evaluate digital assets, consider embedding tools like the Digital Business Valuation Tool to capture high-intent visits.
How to Automate Your Reporting Workflow
Manual reporting wastes time and introduces errors. Automate SEO keyword ranking reports so you spend more time analyzing and less time gathering data.
Connect core data sources: Google Analytics, Google Search Console, and your SEO platform. Use APIs or built-in integrations to centralize keyword rankings, organic traffic, and conversions into a single dashboard.
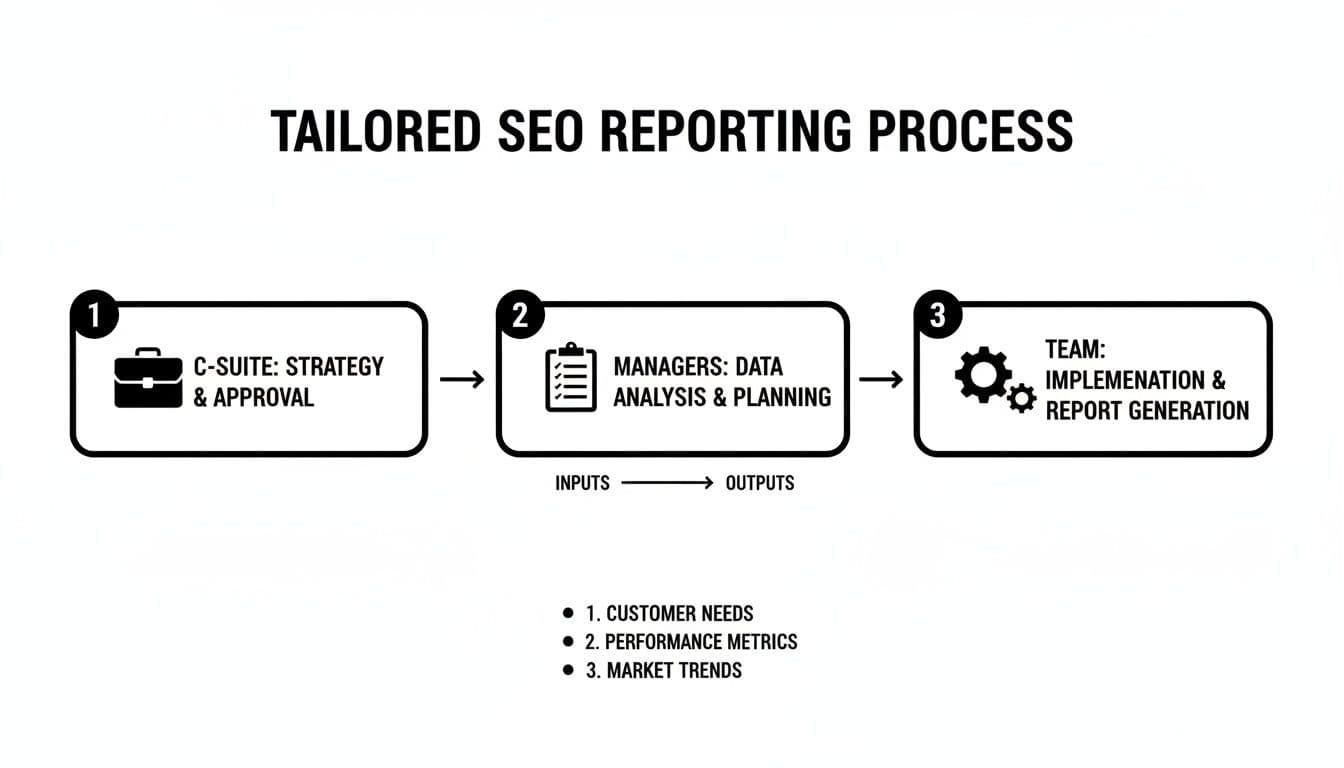
Automation lets you produce tailored outputs: a one-page summary for executives, trend views for managers, and granular datasets for hands-on teams—without creating three manual reports.
Setting Up Delivery and Alerts
Schedule deliveries and alerts. Email stakeholders or post to Slack on a set cadence—for example, every Monday at 9 AM—so everyone has the latest numbers.
Automation isn’t “set it and forget it.” Add quality-assurance checks. For instance, trigger an alert if organic traffic drops more than 15% week-over-week. Alerts turn passive reports into an active watchdog for SEO health.
Turning Reports into Revenue Tools
Automation becomes powerful when you connect SEO data to revenue-generating assets. Embed interactive tools to capture leads and automate data collection so your report shows near-real-time contribution to qualified prospects.
When lead-capture assets feed directly into reporting, you can show precisely how SEO fuels the sales pipeline and prove ROI daily.
For paid vs. organic comparisons, use the Facebook Ads Cost Estimator to benchmark paid spend against organic gains.
Evolve for AI and Long-Tail Search
Search is changing fast. AI overviews and long-tail queries are reshaping results. If you focus only on high-volume head terms, you’re missing opportunity.

Most searches are long, specific, and conversational. A large share of keywords have very low monthly volume, and long-tail queries can generate more clicks than single-word head terms3.
From Keywords to Topic Clusters: A New Reporting Mindset
Future-proof reporting by focusing on user intent and topic clusters, not isolated keywords. Measure authority across topics like “small business financial planning” instead of single terms. Track visibility in AI answers and featured snippets—aim to be the definitive authority on a subject.
Why Interactive Tools Are Your Secret Weapon
Interactive assets answer specific long-tail queries in ways static pages often can’t. They attract high-intent traffic, increase time on site, and earn backlinks.
For example, an embedded ROI tool directly solves a user’s need and captures leads. Use interactive assets strategically to stand out and demonstrate financial impact.
Practical Steps: What to Build First
- Define audience-specific dashboards: executive summary, manager trends, and technical datasets.
- Select KPIs mapped to funnel stages and business goals.
- Connect data sources and automate pipelines.
- Set delivery schedules and failure alerts.
- Embed interactive lead-capture tools and feed data back into reports.
Three Concise Q&A Sections
Q: What should my SEO reports prove?
A: They should prove how SEO drives leads and revenue by linking keyword clusters and topic authority to conversions—not just rank positions.
Q: Who needs which report?
A: Executives get high-level ROI and market-share summaries; managers get trend and campaign views; SEO teams get granular diagnostic data.
Q: How do I scale reporting without manual work?
A: Automate data collection from Analytics, Search Console, and your SEO platform, set delivery schedules and alerts, and embed interactive tools to capture revenue signals automatically.
Ready to create interactive tools that supercharge SEO and make reports impossible to ignore? Consider embedding the Digital Business Valuation Tool to capture high-intent visits and demonstrate measurable impact.
1.
SISTRIX, “Google organic click‑through rate study,” https://www.sistrix.com/blog/google-organic-click-through-rate-study/
2.
HubSpot, “Marketing statistics,” https://www.hubspot.com/marketing-statistics
3.
Ahrefs, “Long‑tail keywords: what they are and how to use them,” https://ahrefs.com/blog/long-tail-keywords/
Gotowy, aby zbudować własne narzędzia za darmo?
Dołącz do setek firm, które już używają niestandardowych narzędzi do szacowania, aby zwiększać zyski i zdobywać więcej klientów
✨ Kodowanie nie wymagane • 🚀 Gotowe w minuty • 💸 Tworzenie za darmo