Learn how to monitor web traffic with our guide. We'll cover the right tools and strategies to analyze visitor data and boost website performance.
February 4, 2026 (5mo ago)
How to Monitor Web Traffic and Turn Data Into Growth
Learn how to monitor web traffic with our guide. We'll cover the right tools and strategies to analyze visitor data and boost website performance.
← Back to blog
Title: Monitor Web Traffic & Turn Data Into Growth
Summary: Learn how to monitor web traffic, choose the right analytics tools, and turn visitor behavior into higher conversions and growth.
Introduction: Monitoring web traffic isn’t just about counting visitors. It’s about understanding the people behind the numbers—who they are, how they found you, and what they want. The right tools and tracking setup help you collect, measure, and analyze data so you can improve user experience, boost conversions, and grow revenue.
Monitoring your web traffic isn't just about counting visitors. It's about understanding the people behind the numbers—who they are, how they found you, and what they're looking for on your site. This is where analytics tools come in, helping you collect, measure, and analyze the data you need to make smart decisions that actually move the needle on business growth, user experience, and marketing ROI.
It’s the only way to know if what you’re doing is really working.
Why You Need to Monitor Web Traffic Now More Than Ever
Trying to grow your business online without looking at your website data is like sailing blind. In today’s crowded digital world, understanding the details of your traffic isn’t just a nice-to-have; it’s essential for survival. The internet is louder than ever, and making decisions based on a hunch is a fast track to wasting time and money.
The challenge is bigger than just competition. Global internet traffic is surging, fueled by a mix of real users, countless bots, and the explosion of mobile devices. Recent data from Cloudflare Radar showed a staggering 19% growth in 20251. This tidal wave of activity makes one thing crystal clear: you have to be able to separate valuable human engagement from automated noise.
Connecting Traffic Data to Profitability
So, how does staring at charts and numbers actually make you more money? It all boils down to where you put your resources. When you can clearly see which marketing channels are bringing qualified leads, you can confidently invest more in what’s working and stop throwing money at what isn’t.
Let’s take a real-world example. A solar company adds an interactive tool like the Residential Solar Cost & Payback Calculator to a blog post. By tracking traffic sources and how visitors engage with that tool, they can learn almost instantly whether their best leads come from targeted local SEO or broad social campaigns.
This kind of granular insight gives them a serious edge:
- Smarter budgeting: Shift marketing spend from underperforming tactics to SEO or channels that bring high-intent visitors.
- Improved content strategy: High engagement with the tool shows an audience preference for value-driven, interactive content.
- Enhanced lead quality: Leads who use the calculator have already qualified themselves, shortening the sales cycle.
“Key takeaway: When you monitor interactions, not just page views, your website transforms from a static online brochure into a dynamic lead-generation machine.”
Ultimately, web traffic data gives you the clarity to separate businesses that are just getting by from those that are set to thrive.
Essential Web Traffic Metrics and Their Real-World Impact
Let’s cut through the jargon. Here’s a breakdown of the metrics that truly matter and how they connect directly to your business goals.
| Metric | What It Really Tells You | How It Drives Business Decisions |
|---|---|---|
| Sessions | The total number of visits to your site. One user can have multiple sessions. | Understand traffic volume and trends over time (seasonality, campaign impact). |
| Users | The number of unique individuals who visited your site. | Shows the actual size of your audience and reach. |
| Bounce rate | Percentage of visitors who leave after viewing only one page. | A high bounce rate can indicate poor UX, irrelevant content, or a mismatch between ad copy and landing page. |
| Session duration | Average time visitors spend on your site during a single visit. | Longer durations often indicate engaging content. Use it to measure content quality. |
| Traffic source | Where your visitors come from (Organic Search, Social, Direct, Referral). | Tells you which channels are most effective, guiding budget allocation. |
| Conversion rate | Percentage of visitors who complete a desired action (purchase, form, signup). | The ultimate measure of website effectiveness—improving this directly impacts revenue. |
Understanding these numbers is the first step. The real magic happens when you connect them to strategic decisions.
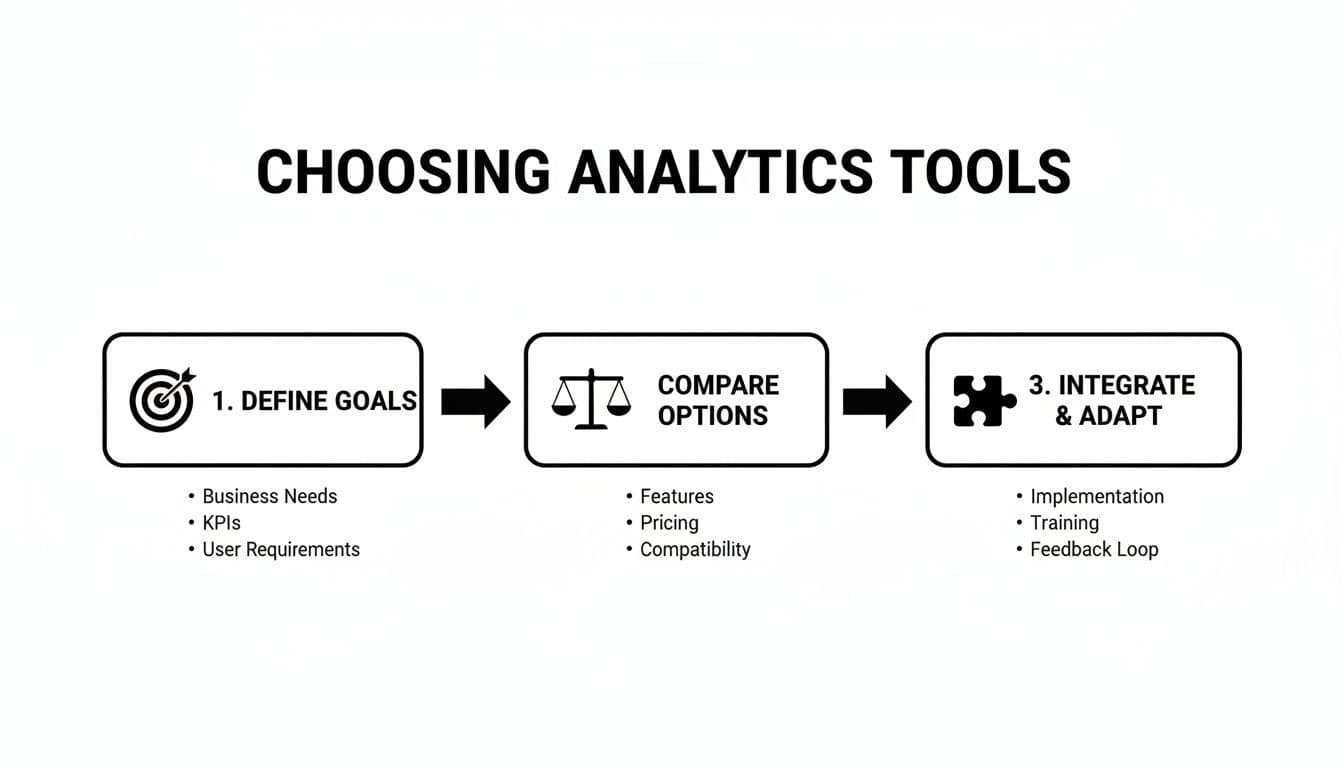
Choosing the Right Tools for Traffic Analysis
Stepping into web analytics can feel overwhelming. There are dozens of tools, all promising insights, but it’s easy to get lost in features. The secret isn’t finding the flashiest platform; it’s picking the right tool for your goals.
The first fork in the road is usually between a massive, all-in-one platform like Google Analytics and a more privacy-focused alternative. While Google Analytics is powerful and free, GA4 has a steep learning curve and raises privacy questions for some organizations. Tools like Matomo or Fathom offer simpler reporting and stronger privacy controls, which can be a big win for your brand4.
Look Beyond Standard Analytics Platforms
Your main analytics platform is only part of the story. Standard tools are great for giving you the “what”—how many people visited, where they came from, what pages they viewed. But they often miss the “why.” They can’t reliably show user intent.
To get intent, add specialized tools: heatmaps, session recordings, and interaction tracking. For example, Hotjar gives heatmaps that visualize where people click and scroll—essential for UX fixes. And embedded interactive tools often provide built-in signals of intent: someone who completes a multi-step calculator just told you they’re serious.
A Practical Example of Intent-Based Tracking
Imagine you run a financial advisory firm. Instead of only tracking page views, you embed a Business Valuation tool such as the Business Valuation Estimator. Now, your analytics can track who completes a full valuation.
This one change gives you a massive advantage:
- Identifies high-quality leads: Users completing a valuation are far more qualified than casual readers.
- Demonstrates content ROI: You can trace new inquiries back to the tool, proving its value.
- Improves sales efficiency: Sales teams focus on warm leads who’ve already indicated intent.
By focusing on tools that measure actions, not just eyeballs, you turn your website from passive to active—a lead qualification engine.
Building Your Traffic Monitoring Foundation
You’ve picked tools. Now get them working on your site. This part can feel technical, but the basics are straightforward. It starts with a tracking code—a small snippet from your analytics provider that collects anonymous session data.
You’ll hear two tracking approaches: client-side and server-side.
- Client-side tracking runs in the user’s browser. It’s easy to set up and captures clicks, scrolls, and pageviews.
- Server-side tracking runs on your server. It’s more resilient to ad blockers and browser restrictions but requires more setup.
To get this right, learn the fundamentals of how tracking works so your data is reliable. Once installed, set up events for the actions that matter: contact forms, demo requests, tool completions, newsletter signups.
Defining Goals That Actually Matter
Collecting a mountain of data is a waste unless you track actions tied to business objectives. Set goals or events for meaningful actions: completed forms, tool completions, purchases, or a “Request a Demo” click.
Why now? Research from Similarweb highlights a trend of “web rot,” where even established sites quietly lose traffic—so monitoring isn’t just for growth; it’s for survival3.
Map out the most valuable interactions on your site and avoid vanity metrics. Pinpoint actions that signal genuine interest.
A Practical Example with Interactive Tools
A SaaS company places a calculator like a Customer Lifetime Value workflow using embedded tools. By firing a custom event when visitors complete the calculation, they transform vague pageviews into tangible leads:
- Creates tangible data for sales outreach.
- Qualifies leads automatically based on behavior.
- Proves content ROI by linking tool usage to closed deals.
By focusing on high-intent actions, analytics become an active tool for sales and marketing.
Turning Raw Data Into Actionable Business Insights
Collecting website data is the easy part. The real work—and where the money is—is turning those numbers into strategy. It’s too easy to be distracted by page views; instead, dig into data that impacts the bottom line.
Watch how users move through your site to spot where they get stuck or drop off. Those friction points are where you’ll find improvements that increase conversions.
From Numbers to Narratives
Every click, scroll, and form submission tells a story. Start segmenting your audience to identify your most valuable customers: Which channels send them? Where do they live? Which devices do they use?
For example, a real estate agent embeds a Mortgage Calculator on a landing page and discovers visitors who choose a 15-year term convert to clients at three times the rate of those who pick 30 years. That insight lets the agent target ads and content to a profitable segment rather than wasting spend on a generic audience.
Document findings in an SEO or analytics report so stakeholders can act on them.
Uncovering Hidden Opportunities in Your Data
Connect user actions to real outcomes. A marketing consultant embedding an advertising planning tool such as the Advertising Rates Estimator can learn which industries use the tool most, what budget ranges they enter, and which ad platforms interest them.
That level of detail lets you:
- Refine services for high-demand industries.
- Create content that answers specific budget and platform questions.
- Build targeted offers that convert.
Also, watch for reporting quirks—GA4 and other platforms can undercount some traffic sources, and specialized guides exist explaining these gaps5. Staying on top of those nuances keeps strategic decisions grounded in reality.
Optimizing Your Site for Mobile Traffic
If your website isn’t built mobile-first, you’re already behind. Mobile-focused monitoring isn’t optional; it’s core to success.
Look past desktop metrics and measure mobile-specific factors: page load speeds on cellular networks, tap targets, and readability on small screens. Test interactions—are users pinching to zoom? Are buttons easy to tap? Reduce friction so mobile visitors complete high-value actions.

The Undeniable Dominance of Mobile
As of July 2025, mobile devices drive roughly 64.35% of global web traffic—a dramatic shift from just 20092. This alone is reason to bias your monitoring and optimization for mobile users.
This is especially critical for businesses using embedded interactive tools. A flawless mobile experience is non-negotiable.
Mobile Monitoring in Action
Imagine a healthcare provider embeds a patient-facing tool such as the Healthcare Procedure Cost Calculator. If mobile completion rates are high, that’s proof the tool is intuitive on phones. The provider can:
- Confirm a strong mobile user experience.
- Build trust by offering a helpful, mobile-friendly tool.
- Generate appointment requests traceable to tool usage.
A good mobile experience saves development costs and generates qualified leads.
Answering Your Biggest Web Traffic Questions
Even with the best setup, questions arise. Here are straightforward answers to the ones I hear most.
How often should I actually check my website traffic?
A weekly check-in hits the sweet spot for most businesses. Daily monitoring invites overreaction to normal fluctuations; monthly checks risk missing problems or opportunities. Set automated alerts for major drops or spikes so you’re notified only when action is needed.
What’s the real difference between direct, organic, and referral traffic?
Think of traffic sources as the roads that lead to your site:
- Direct: Visitors who know your brand and come via bookmarks or typed URLs.
- Organic: Visitors who found you through search engines—often the biggest sign of SEO health.
- Referral: Visitors from links on other sites—an indicator of your backlink and PR strength.
The mix tells you where marketing is working and where to invest.
What’s a good bounce rate, really?
It depends. High bounce can be fine for single-answer pages (like a simple how-to). But a high bounce rate on a landing or product page—typically over 60%—warrants investigation. Ask why visitors leave and whether that behavior aligns with the page’s goal.
Quick Q&A: Common User Questions
Q: What’s the first thing to track?
A: Track the actions tied to your business goal—form submissions, tool completions, demo requests—not just pageviews.
Q: Which analytics setup is best?
A: Start with a mainstream platform for volume (like Google Analytics) and add privacy-friendly or intent-tracking tools as needed.
Q: How do I measure ROI from content?
A: Track tool completions or lead-form conversions and tie them back to closed deals. Use events and UTM parameters to connect traffic to outcomes.
Ready to turn engagement into growth? Explore embedded tools like the Business Valuation Estimator or the Digital Business Valuation Tool to capture high-intent leads and improve conversion tracking.
1.
Cloudflare Radar: global traffic trends and analysis. https://radar.cloudflare.com
2.
Soax research on mobile website traffic (July 2025): mobile traffic share and trends. https://soax.com/research/mobile-website-traffic
3.
Similarweb analysis and commentary on shifting web traffic trends and “web rot.” https://www.similarweb.com
4.
Matomo: privacy-first analytics alternative and documentation. https://matomo.org
5.
Discussion of GA4 reporting quirks, including under-reporting some traffic sources. https://getairefs.com/learn/why-ga4-under-reports-chatgpt-traffic/
Ready to Build Your Own Tools for Free?
Join hundreds of businesses already using custom estimation tools to increase profits and win more clients
✨ No coding required • 🚀 Ready in minutes • 💸 Free to create