Website engagement metrics are the vital signs of your site. They show whether content connects, whether users return, and whether interactions lead to revenue. This article highlights the four metrics that matter, how to measure them with Google Analytics 4 and behavior tools, and clear steps to improve engagement and conversions.
November 17, 2025 (7mo ago) — last updated January 23, 2026 (4mo ago)
Website Engagement Metrics That Drive Growth
Learn the four engagement metrics that reveal real user behavior, how to measure them with GA4 and behavior tools, and steps to boost conversions.
← Back to blog
Website Engagement Metrics That Drive Growth
Summary: Learn four engagement metrics that reveal real user behavior, how to measure them with GA4 and behavior tools, and practical steps to boost conversions.
Introduction
Website engagement metrics are the vital signs of your site. They show whether content connects, whether users return, and whether interactions lead to revenue. This article highlights the four metrics that matter, how to measure them with Google Analytics 4 and behavior tools, and clear steps to improve engagement and conversions.
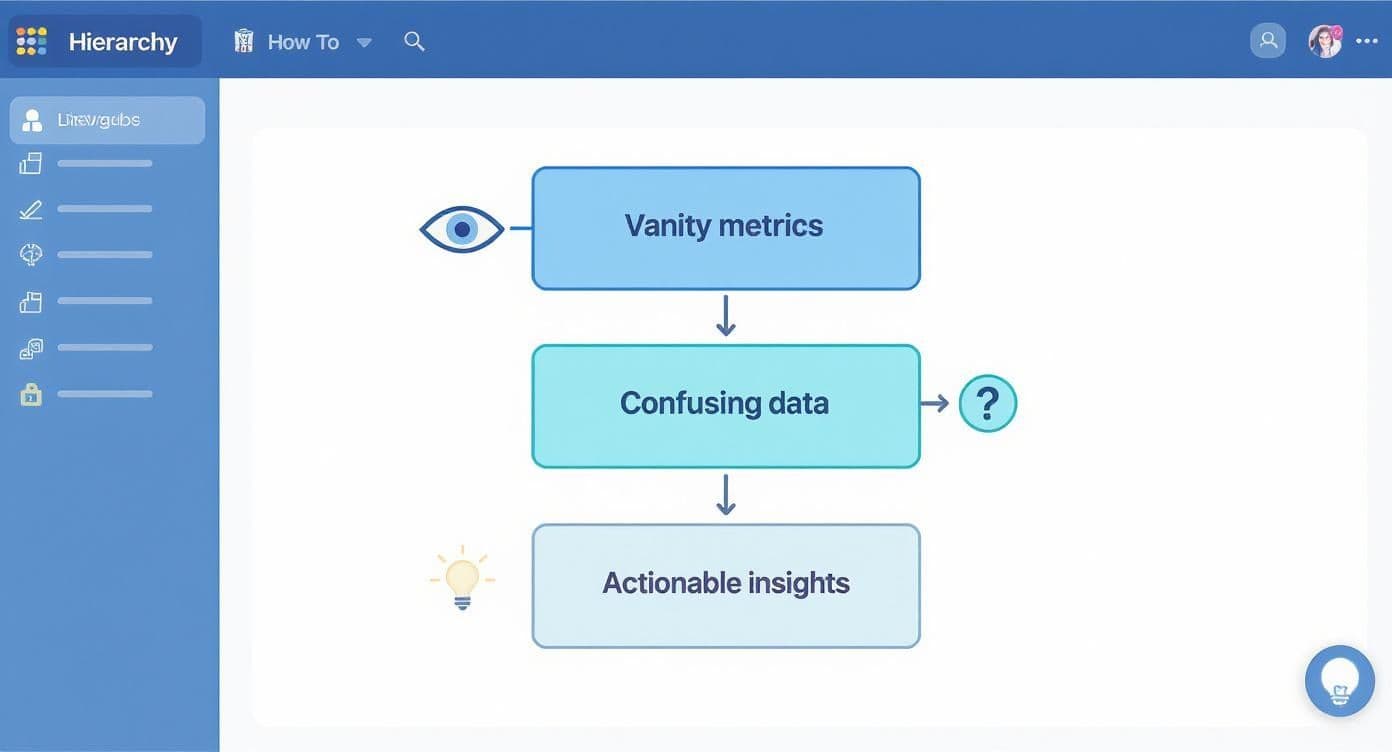
Why Most Engagement Metrics Are Vanity Numbers
Dashboards can be tempting: it feels good to report big numbers. But many metrics are vanity indicators that don’t show business health.
Think of your website as a coffee shop. Page views are like people walking past your window — they look impressive, but they don’t pay the rent. What matters are the people who come inside, buy a coffee, and stay a while. Those are your engaged users.
A visitor who lands and leaves immediately is like someone who peeks in the window and keeps walking. That behavior used to be measured by bounce rate, which can be misleading on its own. It’s more useful to focus on reducing unwanted exits and inviting visitors to engage.
An engaged user stays, reads multiple pages, subscribes, or uses an interactive tool. That’s where real value is created.
“True website engagement isn’t about attracting the most eyeballs; it’s about connecting with the right eyeballs and guiding them on a meaningful journey.”
Before investing in major design changes, validate ideas with tests and tie improvements back to monetary impact using valuation tools like the Business Valuation Estimator.
The Four Core Website Engagement Metrics
Focus on four foundational engagement metrics to get a clear picture of how your website performs.
The Core Four Engagement Metrics at a Glance
| Metric | What It Measures | Why It Matters for Growth |
|---|---|---|
| Engagement Rate | Percentage of sessions where users actively interacted with your site. | Reveals traffic quality and whether your first impression resonates. |
| Average Engagement Time | Time your site was the active window on a user’s screen. | A truer measure of attention and content quality than raw time-on-page. |
| Engaged Sessions per User | Average number of engaged sessions from a returning user. | Measures loyalty and how valuable users find your site. |
| Conversions | Times users complete a desired action (sale, signup). | Connects engagement to tangible business results. |
Looking at these metrics together gives you a fuller picture of user experience and business impact.
1. Engagement Rate
Engagement Rate is the smarter standard in Google Analytics 4. A session counts as engaged if the user meets a time threshold (default 10 seconds), views a second page, or triggers a conversion event1. This filters out accidental visits and short, nonmeaningful sessions.
A low engagement rate is a red flag that your landing content or user experience isn’t connecting.
2. Average Engagement Time
Older metrics like “Average Time on Page” could be misleading because the clock could run while the tab was idle. Average Engagement Time counts only when the page is active in the user’s window, giving a truer picture of attention and content quality1.
High average engagement time signals that your content is useful and holding attention. It’s a stronger indicator of relevance than raw page views.
Engagement Rate tells you whether users decided to stick around. Average Engagement Time tells you how much value they found while there.
3. Engaged Sessions per User
This metric tracks loyalty by measuring how often a single user returns and interacts meaningfully. High engaged sessions per user means your site is a repeatable resource — the foundation of an audience and community.
For example, a buyer using a mortgage tool multiple times signals high intent; linking to an on-site tool like the Mortgage Calculator can help qualify leads.
4. Conversions
Conversions are the actions that matter most: purchases, signups, downloads, contact forms. They tie engagement to revenue and measure whether your site moves visitors closer to business goals.
Common conversion types include:
- Making a purchase
- Signing up for a newsletter
- Filling out a contact form
- Downloading a resource
Track conversions closely and use conversion rate optimization to turn engagement into measurable business results. To translate engagement improvements into business value, use tools such as the Business Valuation Estimator or the Digital Business Valuation Tool.
Going Deeper with Advanced Engagement Metrics
The four core metrics are a great starting point, but advanced metrics give you the nuance needed to pinpoint problems and opportunities.

Scroll Depth Tracking
Scroll Depth tells you how far users go down a page, often measured at 25%, 50%, 75%, and 100%. It’s a content report card: long average sessions with shallow scroll suggest people aren’t reading long-form content.
If most visitors stop at 25%, fix the intro, layout, or scannability. If many reach 75% or more, your content is resonating.
Internal Click-Through Rate (CTR)
Internal CTR tracks clicks on internal links, buttons, and CTAs. Low CTR on an important button is a clear signal to test placement, color, or copy. Internal CTR data is ideal for targeted A/B tests.
Event Tracking for Specific Interactions
Event tracking captures on-page actions that don’t trigger a page load, such as:
- Video plays and completion rates
- File downloads
- Newsletter signups
- Tool interactions (calculators, quizzes)
These micro-engagements are powerful signals of intent. For example, tracking Mortgage Calculator use can surface warm, data-qualified leads.
Event-level data helps prioritize assets that drive engagement. If one downloadable PDF produces most leads, promote it more heavily. If a specific tool attracts visits, build supporting content around it.
The Right Tools for Measuring User Engagement
Knowing which metrics matter is half the battle. You also need tools that capture and explain the behavior behind the numbers.

The Foundation: Google Analytics 4
GA4 is the starting point for most engagement measurement. It gives you engagement rate, average engagement time, conversion tracking, and traffic-source data — the essentials for diagnosis and prioritization1.
GA4 tells you what is happening; behavior tools help explain why.
Visualizing Behavior with Heatmaps and Recordings
Behavior analytics tools reveal where people click, how far they scroll, and where they get stuck. Heatmaps and session recordings let you watch anonymized users navigate your pages, exposing UX friction that raw metrics can’t show4.
A spike in exit rate flagged by GA4 is useful, but watching recordings of users who rage-click on an invisible button tells you exactly what to fix.
Turning Data into Profit with Specialized Tools
Once you’ve identified a change, validate it and estimate its impact. Use reputable A/B testing and sample-size calculators to plan tests and avoid false positives5.
After you improve engagement, translate results into business value with valuation tools such as the Business Valuation Estimator or the Digital Business Valuation Tool. These tools help you show stakeholders clear ROI.
How to Improve Your Website Engagement
Boosting engagement is about selective, strategic improvements — not random experiments. Below are practical steps that move the needle.
Embrace the Power of Video Content
Video communicates value quickly and builds trust. Video often increases traffic, leads, and conversion rates; adding short demo or explainer clips is one of the fastest ways to improve average engagement time and qualification rates3.
A two-minute demo on a pricing page, for example, can boost engagement and help qualify leads faster.
Optimize Your Core User Experience
A slow, confusing site drives users away, no matter how good your content is. Start with these high-impact areas:
- Boost site speed: Faster pages lower abandonment and improve engagement; many visitors leave if a page takes too long to load2.
- Prioritize mobile navigation: Make menus thumb-friendly, buttons easy to tap, and text legible on small screens.
- Clarify CTAs: Use action-oriented copy and high-contrast colors so CTAs are impossible to miss.
Fixing these basics makes your site easier to use, which leads to longer sessions and more conversions.
Make Your Content Interactive and Scannable
Online readers scan more than they read. Structure content for quick scanning with short paragraphs, clear subheadings, bullets, and embedded interactive tools.
Embedding a calculator or quiz turns passive reading into active value. For example, a finance article that includes an embedded Mortgage Calculator or links to the Business Valuation Estimator gives readers immediate, personalized value and increases engagement.
Test and Refine Your Approach
Improving engagement is ongoing testing and learning. Don’t roll out big changes on a hunch. Use sample-size calculations and A/B testing best practices to validate ideas before full rollout5.
Small, data-driven wins add up. Use recordings and heatmaps to generate hypotheses, test them, and measure business impact.
Common Questions About Engagement Metrics
What Is a Good Engagement Rate?
There’s no single answer — benchmarks vary by industry, traffic source, and page type. A general healthy range is often around 60% to 70%, but your focus should be on improving your own baseline over time.
How Is Engagement Rate Different from Bounce Rate?
Engagement Rate is the smarter inverse of the old Bounce Rate. A session counts as engaged if the user meets a time threshold, triggers a conversion event, or views a second page. Bounce Rate simply flagged single-page sessions and couldn’t distinguish a quick satisfying visit from an accidental click1.
Which Metric Matters Most for SEO?
While search engines don’t access your analytics directly, metrics that reflect a great user experience matter for SEO. Average Engagement Time is a strong proxy for content relevance and satisfaction — if users spend time with your content, it’s a signal that your page answers their query well1.
Quick Q&A — Practical Takeaways
Q: Which metric should I fix first if engagement is low?
A: Start with Engagement Rate and Average Engagement Time. If both are low, prioritize landing page clarity, speed, and a clear CTA.
Q: How do I prove engagement improvements to stakeholders?
A: Connect engagement lifts to conversions and model revenue impact with valuation tools like the Business Valuation Estimator.
Q: What mix of tools should I use?
A: Use GA4 for quantitative tracking, a heatmap/recording tool for qualitative insights, and reliable calculators for sample size and ROI modeling45.
Three Common Q&A Summaries
Q: What should I measure first to understand user behavior?
A: Measure Engagement Rate and Average Engagement Time in GA4, then add event tracking for key on-page actions.
Q: How can I quickly boost engagement?
A: Improve page speed, add short videos, clarify CTAs, and embed interactive tools like the Mortgage Calculator.
Q: How do I show ROI from engagement work?
A: Run A/B tests with proper sample-size planning, measure conversion lifts, and translate results into value with the Business Valuation Estimator.
Ready to turn engagement into measurable growth? Embed interactive tools to provide immediate value and capture qualified leads with tools like the Mortgage Calculator or the Business Valuation Estimator.
1.
Google, “Measure user engagement in Google Analytics 4,” https://support.google.com/analytics/answer/9401452.
2.
Google, “Why performance matters,” https://developers.google.com/web/fundamentals/performance/why-performance-matters.
3.
Wyzowl, “Video Marketing Statistics,” https://www.wyzowl.com/video-marketing-statistics/.
4.
Hotjar, “Heatmaps and session recordings: what they are and how to use them,” https://www.hotjar.com/heatmaps/.
5.
Optimizely, “Sample Size Calculator,” https://www.optimizely.com/sample-size-calculator/.
Ready to Build Your Own Tools for Free?
Join hundreds of businesses already using custom estimation tools to increase profits and win more clients
✨ No coding required • 🚀 Ready in minutes • 💸 Free to create