Discover a concise seo monthly reporting format to showcase KPIs, ROI, and impact with an actionable template you can reuse every month.
January 13, 2026 (5mo ago)
Seo monthly reporting format: A Clear Template to Prove ROI
Discover a concise seo monthly reporting format to showcase KPIs, ROI, and impact with an actionable template you can reuse every month.
← Back to blog
SEO Monthly Report Template to Prove ROI
Summary: Use a concise SEO monthly report template to show KPIs, prove ROI, and guide strategy—reusable, audience-specific, and easy to automate.
Introduction
Your monthly SEO report isn’t a spreadsheet graveyard. It’s the story of progress—your best tool for showing value, building trust with stakeholders, and proving SEO is driving business outcomes. This guide turns raw data into a reusable, audience-focused template you can use each month.
Your monthly SEO report isn't just a data dump—it's the story of your progress. It’s the single most important tool you have for showing your value, building trust with clients or stakeholders, and proving that your SEO investment is paying off. This guide will walk you through turning those static spreadsheets into compelling narratives that tie your SEO work directly to real business goals.
Why Your SEO Report Is More Than Just Numbers

No one gets excited about a spreadsheet crammed with metrics. A great SEO report cuts through the noise to provide clarity and direction. Think of it as a bridge connecting your day-to-day work—keyword research, content, technical fixes—to outcomes executives care about: more leads, higher sales, and revenue growth.
A consistent, well-organized SEO monthly reporting format is the foundation of that bridge. When stakeholders see the same layout every month, they know exactly where to find the highlights. That consistency builds confidence and positions you as a strategic partner, not just a technician.
Framing Data as a Strategic Narrative
The real value comes when your report tells a story. Instead of listing that a keyword moved from position 12 to 5, explain why. Maybe a new blog post gained authority, or a competitor lost ground. Context turns raw data into intelligence.
Great reports answer three simple questions:
- What happened? (Key results and changes compared to last month.)
- So what? (Why these changes matter to the business.)
- Now what? (The plan for next month based on the data.)
Proving ROI and Justifying Investment
At the end of the day, your report needs to justify the budget. Don’t stop at “15% increase in organic traffic.” Translate that into potential revenue using embedded calculators or internal models so stakeholders can see the business impact.
You can also show how increased visibility contributes to company value with a valuation tool like the Business Valuation Estimator. Embedding a simple ROI or valuation model turns traffic into dollars, and dollars into a clearer case for continued investment.
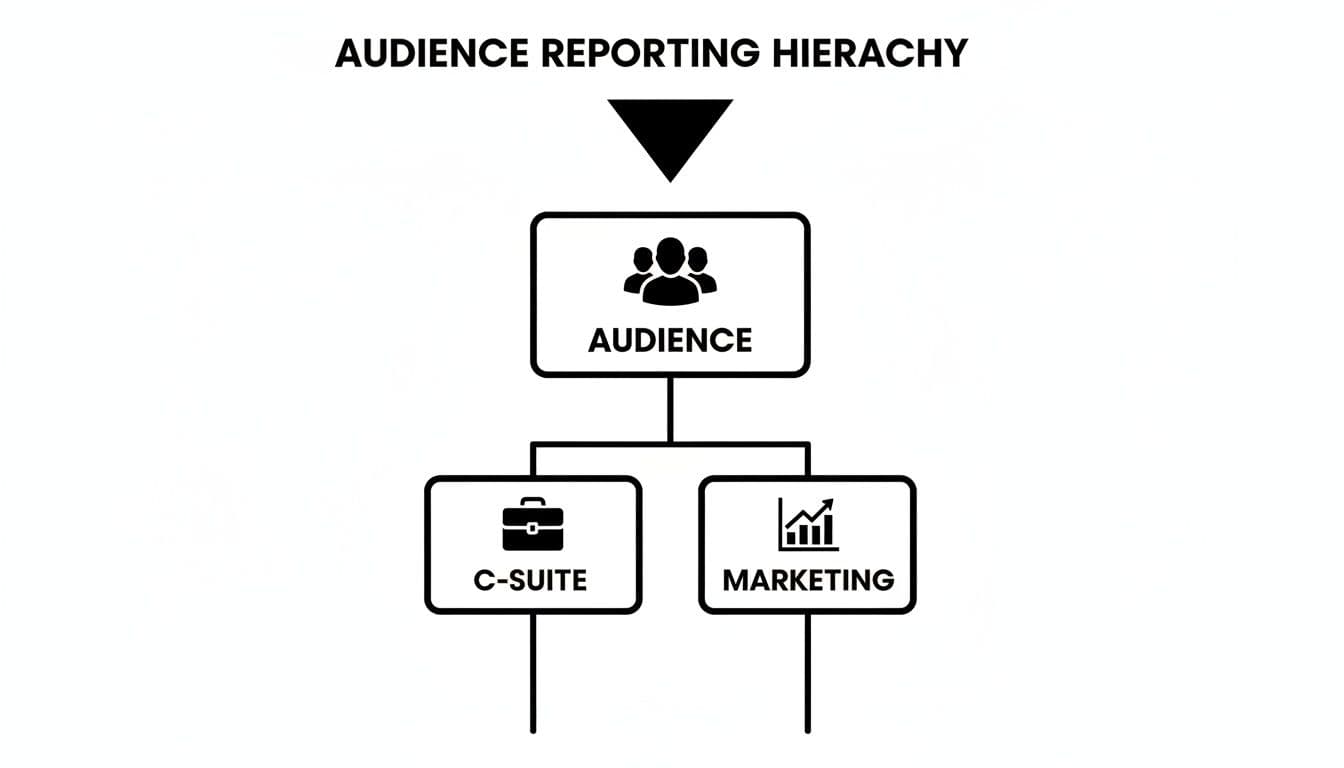
Tailoring Your Report for the Right Audience
One size never fits all. Before you open a spreadsheet, ask: “Who is this for?” The story you tell a CEO should be very different from the one you share with the marketing team.
Executives want high-level impact. Marketing teams need granular details they can act on. Match the content and tone to the reader.
The Executive Summary: The 60-Second Brief
For the C-suite, deliver the bottom line immediately. Answer three questions fast:
- Are we growing? (Show organic lead or revenue trends.)
- Are we profitable? (Frame work in terms of ROI.)
- What are the big wins or threats? (Highest-level strategy.)
A great executive summary takes complex work and boils it down to a few clear sentences so the busiest stakeholder sees SEO’s value in under a minute.
The Marketing Deep Dive: Data for Action
This is where you give the marketing team the blueprint. Include:
- Detailed keyword performance: focus on high-intent terms.
- Organic traffic analysis: by landing page, device, and geography.
- Technical SEO health: Core Web Vitals, indexation, crawl errors.
The more transparent and actionable your details are, the stronger the partnership with your team or client becomes.
Choosing KPIs That Actually Matter
Move past vanity metrics like raw impressions. Choose KPIs tied to growth: for e-commerce, organic transactions; for B2B SaaS, organic qualified leads. Only include metrics that answer a business question.
Most agencies spend about 3–5 hours producing a focused monthly report—frequent enough to make adjustments, but long enough to capture meaningful trends. This rhythm ensures every metric has a purpose and proves the real-world value you deliver.
The Anatomy of a High-Impact SEO Report
A high-impact report is a structured narrative that walks stakeholders from big-picture results to the details. It should answer: What happened? Why did it happen? What are we doing next? Below are the core components to include.
Table: Core Components of a Monthly SEO Report
| Report Section | Primary Goal | Key Metrics to Include |
|---|---|---|
| Executive Summary | Deliver the most critical outcomes and takeaways in under 60 seconds. | Overall organic traffic change, key conversion/lead numbers, primary wins, major roadblocks. |
| Organic Performance | Provide detailed evidence of traffic, visibility, and keyword trends. | MoM/YoY organic traffic, new vs. returning users, keyword ranking changes (top 10), top landing pages. |
| Content & Backlinks | Connect performance changes to specific content and authority-building efforts. | New content performance, backlink acquisition (number and quality), referring domains. |
| Technical SEO | Offer a health check of the website's foundational elements. | Core Web Vitals (LCP, FID/INP, CLS), crawl errors, indexation status, site speed. |
| Insights & Recommendations | Translate data into actionable advice and set the strategy for the next month. | Trend analysis, strategic priorities, next steps, a clear action plan. |
The Executive Summary: The One-Minute Brief
This is the elevator pitch for the month. State the biggest wins, key challenges, and the top priority for the next month. No jargon—just results.
Organic Performance Deep Dive
Back up the summary with evidence: traffic trends, keyword movements, and top pages. Always provide time comparisons (month-over-month and year-over-year) for context.
A strong performance section includes:
- Organic traffic trends with MoM and YoY context.
- Keyword rankings for high-intent, commercial terms.
- Top-performing pages by traffic and conversions.
Content and Backlink Analysis
Explain why performance changed. Did a blog post start ranking? Did a high-authority backlink lift a service page? This is the place for those cause-and-effect connections.
If you quantify content value, consider tools that convert engagement into monetary estimates—such as the Social Media Management Cost Estimator or the YouTube Channel Value Estimator for social-driven impact.
Technical SEO Health Audit
A technically healthy site is critical. This section should cover:
- Site speed and Core Web Vitals—speed affects user behavior and rankings. With many visitors abandoning pages that take too long to load, performance must be monitored closely.2
- Indexation status—are your priority pages indexed?
- Crawl errors—404s and server issues that block bots.
Tailor the depth of technical reporting to the audience: high-level for executives, detailed for the marketing and development teams.
Visualizing Data to Demonstrate Real ROI

A spreadsheet of numbers isn’t convincing. Well-designed charts and graphs make complex information digestible and show ROI clearly.
Choosing the Right Visual for the Job
Pair the visual with the metric:
- Trend lines for growth (organic traffic over time).
- Bar charts for comparisons (competitor visibility, keyword distributions).
- Pie charts sparingly for proportions (traffic source mix).
- Heat maps for on-page engagement.
Connecting SEO Metrics to Real Revenue
Visuals are more persuasive when they tie directly to revenue. Instead of only reporting “5,000 visits,” show the projected revenue using embedded models or calculators. For demonstrating broader business value, include a valuation tool such as the Business Valuation Estimator. Visualize how ranking improvements affect click-through rates and conversions—holding the #1 spot can capture a large share of clicks, making small rank improvements highly valuable.1
A clear chart showing CTR by position reinforces why climbing a few spots can be worth the investment.1
Getting Your Time Back with Smart Automation

Manual reporting wastes time. Automate data pulls from Google Analytics, Search Console, and other tools so you can spend time on analysis instead of copy-and-paste.
Setting Up Your Reporting Dashboard
Connect data sources to a central dashboard. Looker Studio (formerly Google Data Studio) is a common choice for its native connections to Google products. Other options include AgencyAnalytics, DashThis, and Whatagraph for agency reporting.
Once the dashboard is live, core KPIs populate automatically on the first of the month, freeing hours for analysis and strategy.
Take Reports to the Next Level with Interactive Tools
Automation shows “what happened.” Interactive models show “what could happen.” Embed or link to tools that let stakeholders test assumptions—project revenue from search traffic or model keyword opportunity. Tools on MicroEstimates like the Digital Business Valuation Tool and the Business Valuation Estimator make these conversations concrete.
Justify Investment and Build Lasting Trust
Interactive calculators change the conversation from cost to future value. They help stakeholders see SEO as a strategic investment rather than a line item.
By automating data collection and enriching reports with forward-looking calculators, you become a strategic guide rather than just a reporter.
Common Reporting Mistakes That Undermine Your Work
Even good SEOs can sabotage their credibility with a poor report. Avoid these common mistakes to make sure your work gets the credit it deserves.
Focusing on Vanity Metrics
Big numbers like impressions can be misleading. Executives care about revenue, leads, and competitive position. Always connect metrics back to business outcomes so numbers mean something to decision-makers.
The Dreaded Data Dump
Throwing every chart into a doc and calling it a report confuses readers. Your value is interpretation. A report should be a story: last month’s performance, why it happened, and what you’ll do next.
Forgetting the Action Plan
If you don’t provide a clear “Now what?” you miss an opportunity. End each analysis with specific actions—what pages to update, which keywords to target, and timelines for fixes.
Your Top SEO Reporting Questions, Answered
How Often Should I Be Sending SEO Reports?
Monthly is the gold standard: frequent enough to spot trends but not so often that minor fluctuations become noise.3
What’s the Single Most Important Metric to Include?
Organic conversions—leads, sales, or sign-ups from organic search—tie SEO directly to revenue. Treat traffic and rankings as leading indicators, but let conversions be your bottom-line metric.
My Reports Feel Dry. How Can I Make Them More Engaging?
Tell a story. For every chart add one sentence explaining what it means for the business and one recommended action. Use clear visuals and embed interactive calculators or valuation tools such as the Business Valuation Estimator to make results tangible.
Ready to turn reports into interactive tools that prove value? Use MicroEstimates tools like the Business Valuation Estimator and the Digital Business Valuation Tool to convert SEO metrics into business outcomes.
Quick Q&A
Q: What should the executive summary include?
A: One to three sentences on growth (traffic or revenue), ROI framing, and top priorities for the next month.
Q: Which KPIs matter most?
A: Organic conversions first, then traffic quality (conversion rate, bounce rate), and high-intent keyword rankings.
Q: How do I save time producing reports?
A: Automate data pulls into a dashboard and embed interactive calculators to shift focus from data collection to analysis.
1.
Advanced Web Ranking, “Google Organic CTR Study,” https://www.advancedwebranking.com/ctrstudy/
2.
Think with Google, “New industry benchmarks for mobile page speed,” https://www.thinkwithgoogle.com/marketing-resources/data-measurement/mobile-page-speed-new-industry-benchmarks/
3.
Databox, “How often should you report on marketing metrics?” https://databox.com/how-often-should-you-report-on-marketing-metrics
Ready to Build Your Own Tools for Free?
Join hundreds of businesses already using custom estimation tools to increase profits and win more clients
✨ No coding required • 🚀 Ready in minutes • 💸 Free to create