Boosting user engagement starts with delivering immediate value and a frictionless experience. This guide shows practical, data-driven tactics—site speed, scannable content, and embedded tools—to keep visitors and turn them into customers.
January 2, 2026 (5mo ago) — last updated March 22, 2026 (3mo ago)
Increase Website User Engagement: Practical Tips
Proven strategies and interactive tools to boost website engagement, retention, and conversions with data-driven tactics.
← Back to blog
Increase Website User Engagement: Practical Tips & Tactics
Summary: Proven strategies and interactive tools to boost website engagement, retention, and conversions with data-driven tactics.
Discover how to increase user engagement on website with proven strategies, interactive tools, and data-driven tactics to boost retention and conversions.
When you get right down to it, boosting user engagement on your website is about delivering immediate value and a frictionless experience. Shift from chasing clicks to captivating visitors with fast load times, useful content, and interactive experiences that help users solve their problems right away.
Why User Engagement Is Your Most Important Growth Signal
Let’s be blunt: chasing traffic while ignoring engagement is like pouring water into a leaky bucket. You can get a ton of visitors, but if they bounce immediately, you’re burning through ad spend and marketing effort. Sustainable growth comes from understanding why people stick around, not just how they found you.
High engagement tells search engines your site provides real value, which improves SEO, lead quality, and customer lifetime value.

Too many businesses measure success by clicks alone, then scratch their heads when bounce rates soar. When you pivot from attracting visitors to truly captivating them, you build a self-sustaining growth engine. It’s the difference between a site that gets visits and one that earns loyalty.
The Real Cost of a Poor First Impression
You literally have seconds to make an impact. When a visitor lands, they form an impression almost instantly. Research shows many users expect pages to load very quickly—over half will abandon a mobile page that takes longer than three seconds to load1. If your site is slow, your chance to engage is gone before it began.
A slow, confusing, or passive site signals you don’t respect the user’s time, and visitors will find a competitor who does.
“The heart of user engagement isn’t about flashy gimmicks. It’s about providing instant, tangible value that makes a visitor think, “This is exactly what I was looking for.””
From Passive Content to Active Participation
To move the needle, transform the user journey from passive consumption to active participation. Stop only telling visitors what you do and start empowering them to find their own answers. This is where interactive tools change the game.
Think about a financial advisory firm: they could write a long post about retirement planning, or they could offer a calculator that shows concrete numbers. For example, add a Mortgage Calculator so users can see affordability in real terms. A passive reader becomes an active participant, visualizing their financial choices.
For a publisher, a YouTube Channel Value Estimator gives immediate, personalized insight into potential earnings. Tools like these don’t just answer questions; they build trust and keep users on your site longer, improving the engagement metrics that matter.
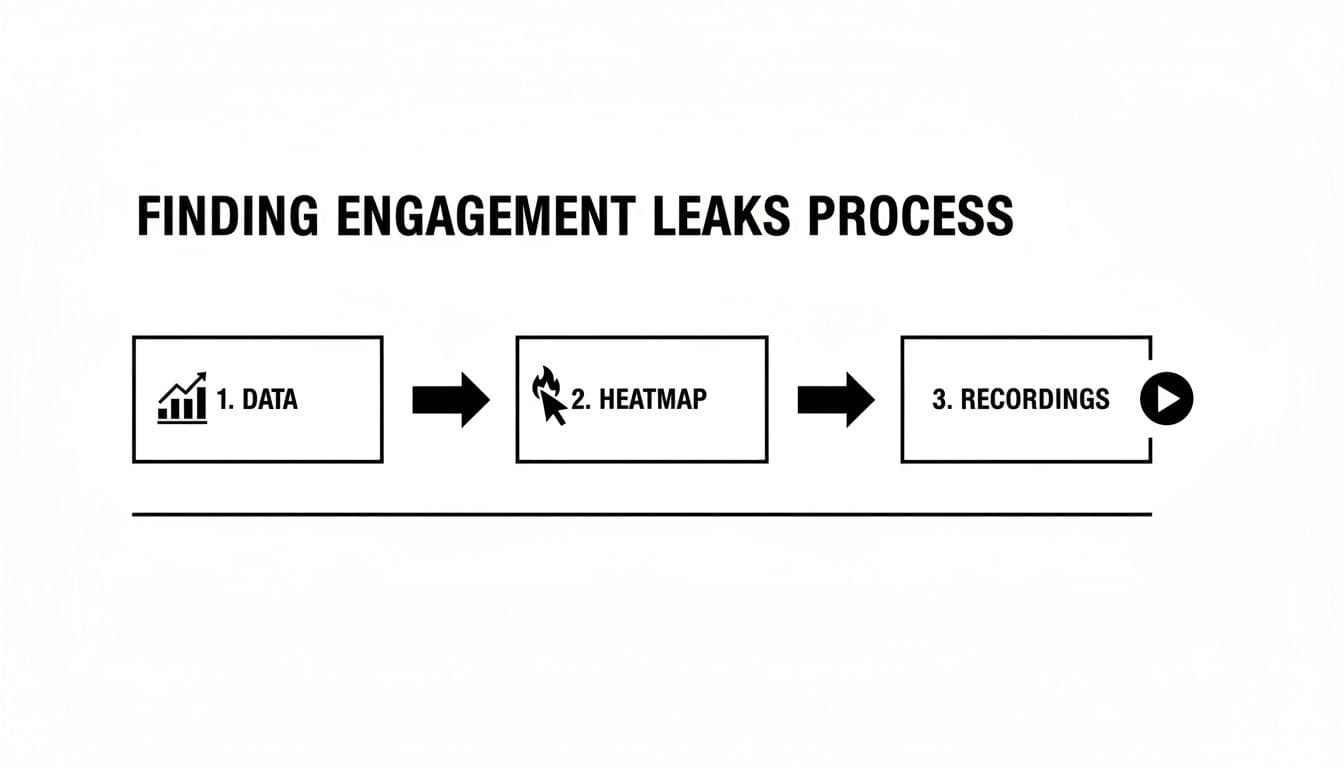
Finding the Leaks in Your Engagement Funnel
Before you improve engagement, play detective. Your site constantly tells you where visitors get lost or bored—you just need to listen. Think of it as finding leaks in a pipe; patching them turns casual browsers into interested users.
Focus on metrics that show behavior, not just arrival counts.
What the Data in Google Analytics 4 Is Really Telling You
Google Analytics 4 (GA4) gives better ways to measure engagement than legacy metrics. Track engaged sessions, average engagement time, and views per user to find patterns by page2. When a page shows high exit rate or low engagement time, treat it like a leak.
Go Visual with Heatmaps and Session Recordings
GA4 tells you what happened; tools like Hotjar and Microsoft Clarity show you why. Heatmaps reveal where people click and how far they scroll; session recordings let you watch real journeys. These visual tools reveal usability problems numbers can miss3.
“I’m not exaggerating when I say watching session recordings can reveal more about your site’s problems than staring at spreadsheets for a week.”
Pulling It All Together: Your Engagement Audit
Combine GA4 data with heatmaps and recordings to run an engagement audit. That shows whether the root cause is technical, weak content, or a clunky experience.
A practical example:
- GA4 shows a landing page has an unusually high exit rate.
- A heatmap reveals almost no one scrolls past the banner.
- A session recording shows users repeatedly clicking a non-interactive image in that banner and then leaving.
Now you’ve gone from guessing to knowing. You have evidence-based direction on where the leaks are and how to patch them.
Your Tactical Playbook for On-Page Interaction
You’ve pinpointed where users bail. Now make hands-on changes that convince them to stick around, click, and convert. These tactics reduce friction and deliver instant value.
Start with a solid foundation: clear site structure and intuitive navigation. If users can’t find what they need, the fanciest tools won’t save you. For practical steps on speed tuning, see /guides/site-speed-optimization.
Craft Scannable Content That Actually Solves a Problem
People scan. They look for quick answers, key stats, and signs they’re in the right place. To keep them on the page:
- Use bold text for key takeaways so scanners absorb main points.
- Write short paragraphs (1–3 sentences) to create white space.
- Break content with clear H2 and H3 headings so users can jump to what they need.
- Use lists and numbered steps to simplify complex ideas.
Making content easy to consume shows respect for the user’s time and boosts trust.
The Real Game-Changer: Interactive Content
Scannable content reduces bounce; interactive content drives deeper engagement. Interactive tools pull users from passive reading into active discovery, answering, “What does this mean for me?”
For service businesses, an embedded tool can provide immediate utility. For example, a contractor can add a Home Renovation Budget Estimator so visitors get personalized cost estimates on the page. That immediate value increases time on page and produces more qualified leads.
Interactive tools are often low effort to add and high impact in results.
A Real-World Example: The Contractor’s Dilemma
A renovation contractor’s site gets traffic but mixed leads. One visitor wants a small refresh, another a full remodel. The team wastes hours qualifying leads by phone.
Embedding a Home Renovation Budget Estimator on their services page lets a visitor input project details—square footage, materials, room type—and get an instant estimate.
This delivers three wins:
- Immediate value for the user.
- Longer time on page, which search engines notice.
- Better-qualified leads when visitors provide contact details to get a full estimate.
Beyond Construction: Financial Services and SaaS
This approach works across industries. A B2B SaaS vendor could offer an ROI-style tool such as the Facebook Ads Cost Estimator so prospects plug in their own metrics and see potential savings or gains. That ties the product to profit and transforms conversations.
Many tools on platforms like MicroEstimates are easy to build and embed with a single line of code.
Engagement Tactics: High vs Low Effort
Not all tactics are equal. Some are quick wins; others require planning. Use this breakdown to prioritize:
| Tactic | Potential Impact | Effort Level | Example Use Case |
|---|---|---|---|
| Scannable content formatting | Medium | Low | Reformat a long post with bold takeaways and short paragraphs. |
| Interactive calculators & quizzes | High | Low | Embed a mortgage or renovation estimator to capture high-intent leads. |
| Live chat implementation | Medium–High | Medium | Add chat to a pricing page for real-time answers. |
| Personalized content (logged-in) | High | High | A dashboard showing a personalized health score based on usage. |
| Website speed optimization | High | Varies | Compress images and enable caching to cut load time. |
A quick formatting pass is always a good start; interactive tools often deliver the largest lift.
Turning First-Time Visitors into Loyal Users
Getting a visitor to have one great interaction is a win. The real goal is turning that interaction into a relationship. Use initial behavior as a signal and follow up with value that feels personal.

Go Beyond “Hi [First Name]” Personalization
True personalization tailors the journey to demonstrated interests. If a visitor uses a particular tool or spends time on a topic, use that signal to send relevant content rather than a generic newsletter.
For example, someone who uses a Mortgage Calculator or a Home Renovation Budget Estimator is signaling purchase intent. Follow up with targeted resources: how-to guides, case studies, or invitations to webinars that relate directly to their action.
Build Smart Retention Funnels
A retention funnel is an automated sequence that nurtures a user’s interest. Trigger the funnel with a high-engagement action—like interacting with an embedded tool—so you nurture the most qualified prospects.
Example funnel for a business valuation lead:
- Day 1: Deliver the detailed valuation report.
- Day 4: Send a relevant case study.
- Day 10: Share a tactical guide on common mistakes.
- Day 20: Invite them to a private webinar.
Using a tool as the entry point makes follow-up feel personal and helpful, not salesy.
Measuring Your Wins and Planning Your Next Move
You rolled out changes—now measure impact. Improving engagement isn’t one-and-done; it’s a continuous cycle of testing, learning, and refining.
This is where you move from “I think this will work” to “I know this works.” Build a culture of experimentation and treat every change as a hypothesis to test.
Setting Up Simple A/B Tests
You don’t need a huge tech stack to start testing. A basic A/B test can show which headline, CTA, or placement drives more interactions. For example, test two headlines for a page with a calculator and track which version leads to more completions.
Connecting Actions to Your KPIs
Link changes to the KPIs that matter. If you add a tool, track average engagement time, goal completions (tool results), and scroll depth. Isolate the specific metrics your change was designed to influence so you can prove value.
Track these metrics after adding an interactive estimator:
- Average engagement time on the page
- Custom events for tool completions in GA4
- Scroll depth and downstream conversions
When you can say, “Adding this tool increased time on page by 45% and generated 300% more qualified leads,” you’ll get buy-in for the next experiment.
Key Engagement Metrics to Track
| Metric | What It Measures | Tool to Use | Good Benchmark |
|---|---|---|---|
| Time on Page / Engagement Time | How long users actively spend on a page. | Google Analytics 4 | 2–3 minutes for content pages |
| Scroll Depth | How far users scroll through a page. | Hotjar, GA4 | 75% or more indicates strong interest |
| Click-Through Rate (CTR) | Percentage who click a specific CTA. | Search Console, A/B tools | >3% is often a solid start |
| Goal Completions | Times users complete a defined action. | Google Analytics 4 | Set based on goals |
| Engagement Rate (GA4) | Percentage of engaged sessions. | Google Analytics 4 | Aim for >60% |
| Interactive Tool Usage | How many users complete an embedded tool. | Custom GA4 events | Track completions as micro-conversions |
Fostering a Culture of Experimentation
One successful experiment is great, but a consistent testing program builds an unstoppable growth engine. Win, learn, and test again—every result teaches you something.
Common Questions About Website Engagement
We’ve covered many tactics. Here are answers to the most common questions product managers, SEOs, and founders ask.
What’s the Real Difference Between Traffic and Engagement?
Traffic is people who arrive. Engagement is what they do once they’re there. High traffic with low engagement often signals a mismatch between what your snippet promised and what your page delivers. High engagement indicates you’re meeting user intent, which is a stronger signal for conversions and SEO.
How Can I Boost Engagement on a Tight Budget?
You don’t need a big budget. Start with site speed and readability: compress images, reduce scripts, use short paragraphs, and clear headings. No-code interactive tools are a high-value, low-cost option for many teams.
How Soon Can I Expect to See Results?
It depends:
- Quick wins (days–weeks): technical fixes like speed improvements can reduce bounce almost immediately.
- Medium impact (weeks–months): adding a relevant interactive tool can lift engagement as traffic finds and uses it.
- Long game (months): content overhauls and deep personalization take longer to move the needle on SEO and retention.
Which Interactive Tools Work Best for B2B Websites?
For B2B, focus on utility: ROI calculators, pricing configurators, and TCO estimators. These help prospects build a business case on the spot and often drive better-qualified leads.
Quick Q&A
Q: What’s the fastest way to reduce bounce?
A: Improve page speed and make content scannable—short paragraphs, clear headings, and bold takeaways.
Q: Which interactive tool gives the best ROI?
A: Tools that answer a prospect’s primary buying question—ROI or cost estimators—tend to drive the biggest lift.
Q: How do I prove a tool worked?
A: Track tool completions, engagement time, and goal conversions in GA4 and report the delta before and after deployment.
Three Concise Q&A Sections (Bottom)
Q: Where should I add interactive tools first?
A: Start on high-traffic, high-intent pages—pricing, services, and product pages—where a tool answers a buyer’s main question.
Q: Which metric shows a tool is working?
A: Tool completion events in GA4, paired with increased time on page and downstream conversions.
Q: One quick improvement to start today?
A: Compress images and enable browser caching to cut load time and reduce immediate bounce.
1.
Think with Google, “Mobile Page Speed: New Industry Benchmarks,” https://www.thinkwithgoogle.com/consumer-insights/consumer-trends/mobile-page-speed-new-industry-benchmarks/
2.
Google Analytics Help, “Engagement and engaged sessions in Google Analytics 4,” https://support.google.com/analytics/answer/10120322?hl=en
3.
Hotjar, “How heatmaps and session recordings help you understand users,” https://www.hotjar.com/blog/heatmaps/
Ready to Build Your Own Tools for Free?
Join hundreds of businesses already using custom estimation tools to increase profits and win more clients
✨ No coding required • 🚀 Ready in minutes • 💸 Free to create