Tired of confusing metrics? Learn how to calculate ROI for marketing with clear formulas, real-world examples, and actionable steps to prove your value.
December 12, 2025 (7mo ago)
How to Calculate ROI for Marketing A Practical Guide
Tired of confusing metrics? Learn how to calculate ROI for marketing with clear formulas, real-world examples, and actionable steps to prove your value.
← Back to blog
Title: How to Calculate Marketing ROI (Practical Guide)
Summary: Tired of confusing metrics? Learn how to calculate marketing ROI with clear formulas, examples, and steps to prove your value.
Introduction: Tired of confusing metrics? Learn how to calculate marketing ROI with clear formulas, real-world examples, and actionable steps to prove your value.
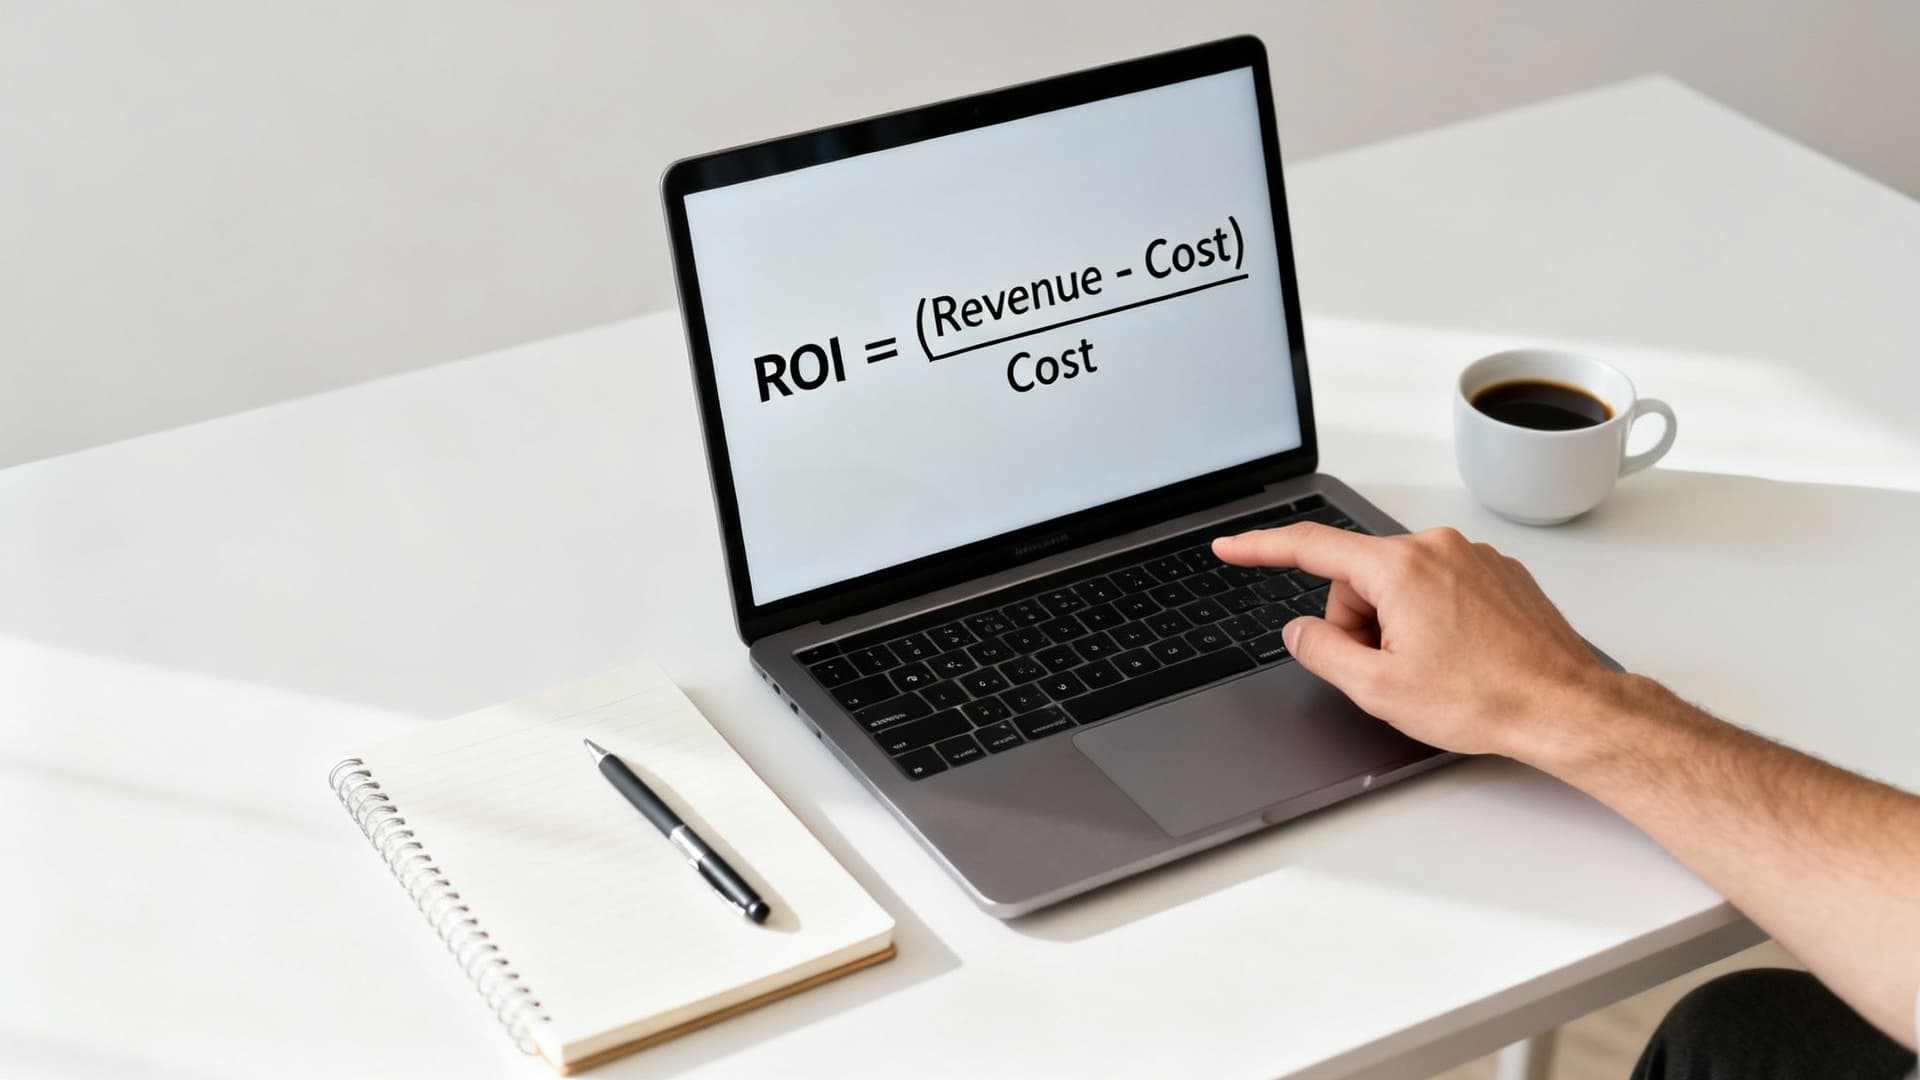
At its core, calculating your marketing ROI boils down to a straightforward formula: (Sales Growth - Marketing Cost) / Marketing Cost. When you multiply the result by 100, you get a simple percentage that tells you how profitable your campaign was. This single number is often the first, most crucial step in shifting the conversation from marketing being a “cost” to being a powerful profit driver.
Finally, a Clear Answer on How to Calculate Marketing ROI
Let’s be honest, trying to justify your marketing budget with fuzzy metrics like “impressions” or “engagement” is a losing battle. The C-suite speaks the language of revenue and profit, and if you can’t translate your efforts into those terms, you’ll always be on the defensive.
The good news is you don’t need a Ph.D. in data science to prove your worth. It all starts with a simple, reliable way to measure your return on investment.
This guide will cut through the noise. We’ll start with the foundational formula every marketer should have in their back pocket and then build from there, adding real-world context and nuance. Think of this as your playbook for turning the marketing department from a perceived cost center into an undeniable growth engine.
The Core Marketing ROI Formulas
The simple ROI formula is your go-to for a quick health check on any campaign. It gives you a clear, defensible number that instantly signals whether your efforts are making money. While we’ll get into more advanced calculations later, this is where you always start.
Over 60% of marketers begin with a basic ROI calculation because it’s so direct1. Good campaigns often aim for a 5:1 ratio, which translates to a 500% ROI. It’s a powerful benchmark that gets straight to the point.
Core Marketing ROI Formulas at a Glance
| Formula Type | Calculation | Best Used For |
|---|---|---|
| Basic ROI | (Sales Growth - Marketing Spend) / Marketing Spend | Quick, high-level analysis of campaign profitability; comparing channels. |
| Gross Profit ROI | (Sales Growth - COGS - Marketing Spend) / Marketing Spend | More accurate view that accounts for cost of goods sold, revealing true profit. |
These formulas provide the bedrock for your analysis. Choosing the right one depends on how deep you need to go and what your leadership team wants to see.
Laying the Groundwork for an Accurate Calculation
Before you can plug numbers into a formula, you need to know exactly what those numbers are. Your “Marketing Cost” isn’t just the ad spend—it's the whole picture. This includes everything from agency fees and software subscriptions to the prorated salaries of the team members who worked on the campaign.
Getting this right is non-negotiable for an honest ROI figure. If you want to dig deeper into acquisition costs and how they affect ROI, tools like the Email List Value Estimator can help you put dollar values on certain channels.
The ultimate goal isn’t just to calculate ROI once; it’s to build a repeatable process that gives you unshakeable confidence in your numbers. This is how you start making smarter, data-driven decisions that fuel real business growth.
Once you master this basic calculation, you gain the credibility to talk about marketing’s value in financial terms.
Gathering Your Data Without Losing Your Mind

Before you plug a single number into a formula, you need the right ingredients. A marketing ROI calculation is only as good as the data you feed it. This is the step where things either come together perfectly or go completely off the rails.
The goal isn’t to scramble for numbers; it’s to build a solid, repeatable process for gathering them without pulling your hair out every month.
Defining Your Total Marketing Investment
Let’s talk costs first. It’s so easy to just look at your ad spend and call it a day, but that’s the fastest way to get a wildly inflated, inaccurate ROI. To get a true picture of what you’re actually investing, you have to account for everything.
Think of your total marketing investment as the sum of all resources you poured into a campaign. This means digging deeper than the invoice from Google Ads.
Here’s what a complete cost breakdown should include:
- Direct Ad Spend: what you pay platforms like Meta, Google, or LinkedIn to run your ads.
- Agency or Freelancer Fees: outsourced strategy, creative, or media fees.
- Software and Tools: subscriptions for email platforms, SEO tools, analytics software, and other tech in your marketing stack.
- Content Creation Costs: photographers, videographers, designers, or copywriters.
- Prorated Salaries: the portion of your team’s salaries dedicated to the campaign.
Trust me, gathering these numbers might feel tedious at first, but it’s what stops you from reporting a 300% ROI that’s actually closer to 150%.
Tracking Revenue and Attributing Sales
Once you have your costs nailed down, it’s time to track the revenue your campaign generated. This is where things can get tricky, especially if you have a long sales cycle or customers interact with you across multiple channels. Clean data is your absolute best friend.
To connect sales directly to your campaigns, consistent use of UTM parameters lets you tag traffic, so you can see in your analytics which ad, email, or social post drove a sale. Your CRM is the other source of truth, showing which leads from a campaign eventually became paying customers.
This leads to the unavoidable question of attribution.
Attribution modeling is simply how you assign credit for a conversion when a customer has multiple touchpoints with your brand. The model you choose directly impacts your final ROI calculation, so you need to understand the options.
Common Attribution Models
- First-Touch Attribution: gives 100% of the credit to the first marketing touchpoint. Useful for awareness channel measurement.
- Last-Touch Attribution: gives 100% of the credit to the final interaction before a sale. Simple, but it often overvalues bottom-of-funnel activities and ignores earlier work.
- Multi-Touch Attribution: distributes credit across touchpoints. Models like Linear (equal credit) or Time Decay (more credit to recent interactions) paint a fuller picture.
Choosing the right model depends on your business. An e-commerce store with a quick sales cycle might be fine with last-touch attribution. A B2B company with a six-month sales cycle needs a multi-touch model to properly value content and nurturing.
The simple ROI formula is a great first look. It gives you a quick number to see if a campaign is working. But if you stop there, you’re missing a huge part of the story. Relying only on total revenue versus ad spend can give you a dangerously incomplete picture, especially when your goal is to build a truly profitable marketing machine.
Factoring in Gross Profit for a Truer ROI
If you sell physical products, the basic ROI formula has a blind spot: it treats every dollar of revenue as pure profit. It ignores the Cost of Goods Sold (COGS), which is what it costs you to make or buy the things you sell.
The Gross Profit ROI formula fixes that by subtracting COGS first. The calculation is:
(Gross Profit - Marketing Investment) / Marketing Investment
By subtracting your COGS from revenue before you calculate return, you measure the return on your actual profit. This one adjustment keeps you from thinking a campaign is a huge success when, in reality, it’s barely breaking even.
A Sprinklr study of hundreds of brands highlights how omitting COGS can inflate perceived returns, so account for product costs whenever they exist2.
The Ultimate Health Check for SaaS and Service Businesses
For SaaS companies and service-based businesses, there’s no COGS in the traditional sense. Instead, your long-term survival depends on the balance between Customer Acquisition Cost (CAC) and Customer Lifetime Value (LTV).
- Customer Acquisition Cost (CAC): the total you spend on sales and marketing to land one new customer.
- Customer Lifetime Value (LTV): the total revenue you can reasonably expect to earn from a customer over their entire time with you.
A commonly cited benchmark for a healthy business model is an LTV:CAC ratio around 3:1, meaning you should get roughly three dollars back for every dollar spent on acquisition3. If your ratio is closer to 1:1, you’re likely losing money after other operating costs. If you’re above 5:1, you might be underinvesting in growth.
To estimate lifetime value or test acquisition scenarios, consider tools like the Business Valuation Estimator for higher-level modeling.
Putting ROI Formulas Into Practice
Knowing the formulas is one thing, but putting them to work is where you see real impact. Below are practical scenarios that show how different businesses calculate marketing ROI.
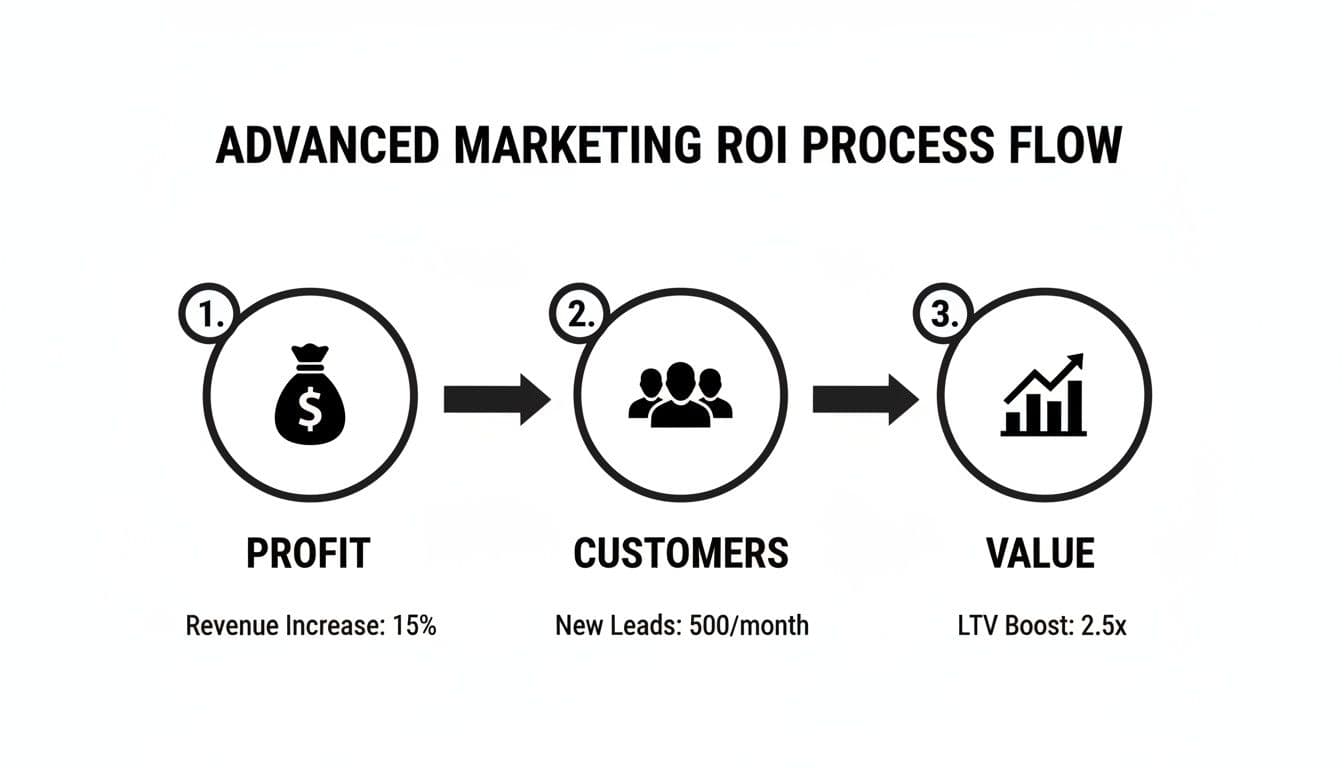
The big takeaway is that ROI isn’t static. It’s about reinvesting profits to get more customers, who then drive more long-term value and fund the next round of growth.
A Local Service Business Running Google Ads
Pipe Masters runs Google Ads to get emergency repair calls. Their monthly costs:
- Google Ads Spend: $1,500
- Agency Fee: $500
- Landing Page Software: $50
- Total Marketing Investment: $2,050
Results: 50 leads, with a historical close rate of 20% (10 jobs). Average ticket: $450.
Total Revenue: 10 × $450 = $4,500
ROI = [($4,500 − $2,050) / $2,050] × 100 = 119.5%
A 119.5% ROI means every dollar spent returned that dollar plus about $1.20 in profit. This tells them the campaign is working and likely worth scaling.
An E-commerce Store’s Facebook Ad Promotion
Zen Candles promoted a new product line with Facebook ads. Their one-week campaign:
- Facebook Ad Spend: $2,000
- Content Creation: $400
- Total Marketing Investment: $2,400
Sales: $8,000. Each candle sells for $20, with COGS $8, so gross profit margin is 60%.
Gross Profit: $8,000 × 60% = $4,800
Gross Profit ROI = [($4,800 − $2,400) / $2,400] × 100 = 100%
A 100% ROI is solid; they doubled their money after covering product and marketing costs. Using revenue alone would’ve shown a 233% ROI, an inflated view that could lead to bad decisions.
For channel-specific planning, tools like the Facebook Ads Cost Estimator can help size budgets and expectations.
Where Marketers Get ROI Wrong (And How to Get It Right)
Calculating marketing ROI moves the conversation beyond vanity metrics, but a few common mistakes can still undermine your analysis. Fix these and your ROI becomes a reliable tool for decisions.
Judging a Campaign Too Soon
One frequent mistake is expecting instant results. If a B2B SaaS product has a typical six-month sales cycle, measuring ROI after 30 days will look terrible. Align your measurement window with your business rhythm. Fast-fashion e-commerce can measure weekly; high-ticket B2B should measure quarterly or semi-annually.
Obsessing Over the Last Click
Last-touch attribution gives all the credit to the final click and ignores earlier influences like helpful blog posts, webinars, or early ads. This often leads companies to slash top-of-funnel budgets because their immediate ROI looks low. Use multi-touch models when your sales cycle involves multiple touchpoints.
Forgetting About All the Other Costs
Another common error is calculating ROI based only on ad spend. That paints a false picture. Include agency fees, software, content creation, and your team’s time. Forgetting these costs can inflate your ROI, sometimes by 100% or more.
To present a credible case for budget, show leadership the long-term impact of reinvesting marketing profits. For higher-level modeling, try the Business Valuation Estimator.
Answering Your Top Marketing ROI Questions
What Is a Good ROI for Marketing?
There’s no single answer. Across industries a 5:1 ratio (500% ROI) is a common benchmark, but context matters. Startups might accept 2:1 for growth, while established companies may expect higher ratios. The goal is consistent, predictable returns that fuel sustainable growth.
How Often Should I Calculate Marketing ROI?
Match your cadence to your sales cycle. Short sales cycles: weekly or bi-weekly checks. Long sales cycles: quarterly or semi-annual full ROI calculations, with monthly checks on leading indicators like MQLs.
How Do I Measure ROI for SEO and Content?
Think long term and set up analytics correctly from the start. Attribute a portion of organic traffic revenue back to your SEO investment, including content creation costs and salaries. For content, track leads generated from specific assets, assign a dollar value based on close rates and LTV, and compare that to creation and promotion costs.
Quick Q&A (Common User Questions)
Q: How do I include team time in marketing costs?
A: Track hours spent on a campaign and multiply by hourly rates or prorate monthly salaries. Add that number to ad spend and vendor costs for total investment.
Q: Which attribution model should I use?
A: Use first-touch to evaluate awareness channels, last-touch for bottom-of-funnel performance, and multi-touch for a balanced view—especially with long sales cycles.
Q: How can I avoid inflating ROI?
A: Include all costs (COGS, tools, agency fees, salaries) and use an attribution model that matches your customer journey. Measure over an appropriate time window.
1.
HubSpot, “Marketing Statistics,” accessed 2024, https://www.hubspot.com/marketing-statistics.
2.
Sprinklr research on digital advertising and return metrics, accessed 2024, https://www.sprinklr.com.
3.
SaaS Capital, “LTV to CAC Ratio: What It Means and How to Use It,” accessed 2024, https://www.saas-capital.com.
Ready to Build Your Own Tools for Free?
Join hundreds of businesses already using custom estimation tools to increase profits and win more clients
✨ No coding required • 🚀 Ready in minutes • 💸 Free to create