Cost optimization in the supply chain isn’t about indiscriminate cuts. It’s about using data, better process design, and selective technology to lower logistics and inventory costs while improving service and resilience. This guide shares proven strategies, practical tools, and step-by-step actions you can use now to capture quick wins and build longer-term savings.
August 1, 2025 (9mo ago) — last updated February 9, 2026 (3mo ago)
Supply Chain Cost Optimization with AI
Data-driven strategies and accessible AI tools to cut transportation and inventory costs, improve service, and boost supply chain profitability.
← Back to blog
Supply Chain Cost Optimization with AI
Discover practical strategies to reduce logistics and inventory costs, boost profitability, and build a resilient, data-driven supply chain.
Introduction
Cost optimization in the supply chain isn’t about indiscriminate cuts. It’s about using data, better process design, and selective technology to lower logistics and inventory costs while improving service and resilience. This guide shares proven strategies, practical tools, and step-by-step actions you can use now to capture quick wins and build longer-term savings.
Why modern cost optimization beats old-school cuts
Forget hacking away at budgets. Today’s supply chain cost optimization focuses on designing a smarter, more resilient operation that lowers costs without degrading service. Optimization balances cost, service, and risk by centering decisions on accurate data rather than gut instinct.
Think of your supply chain as a high-performance engine: the goal isn’t simply to burn less fuel, but to fine-tune every part so the whole machine runs efficiently. That requires asking the right questions and backing them with data: do you hold too much inventory? Are your shipping lanes actually optimal? Would a slightly more expensive but more reliable supplier save money downstream?
Move from guesswork to data-driven decisions
Modern optimization is built on accurate data and focused tools. For example, a small e-commerce shop can use the Logistics Shipping Cost Predictor to compare carriers for specific package sizes and destination zones. Finding a regional carrier that offers a recurring 15% savings on a common zone can add hundreds of dollars back to margins each month.
By shifting to granular analysis, you make surgical improvements that raise profitability without causing collateral damage to service or production. Logistics can represent up to 50% of a product’s final cost in some industries1, so small improvements compound quickly.
The four core cost drivers
If you want to control costs, map where your money goes. Break the operation into four drivers: transportation, inventory, warehousing, and technology. Each has visible and hidden costs you can address.

1) Transportation: the arteries of your operation
Transportation includes obvious charges (carrier fees, fuel, labor) and subtle leak points (inefficient routing, expedited fixes, half-full trucks). Small inefficiencies compound quickly.
What to do:
- Model lanes and compare carriers before booking using the Logistics Shipping Cost Predictor.
- Move from reactive to proactive planning and build rate benchmarking into procurement.
- Consider multi-carrier strategies for different package profiles.
2) Inventory: a double-edged sword
Inventory ensures service but ties up capital. Carrying costs typically include storage, insurance, obsolescence, and capital costs, and can reach 20–30% of inventory value annually2.
Key tactics:
- Run an ABC analysis to prioritize fast-moving, high-value SKUs.
- Use demand variability and lead-time data to calculate safety stock precisely.
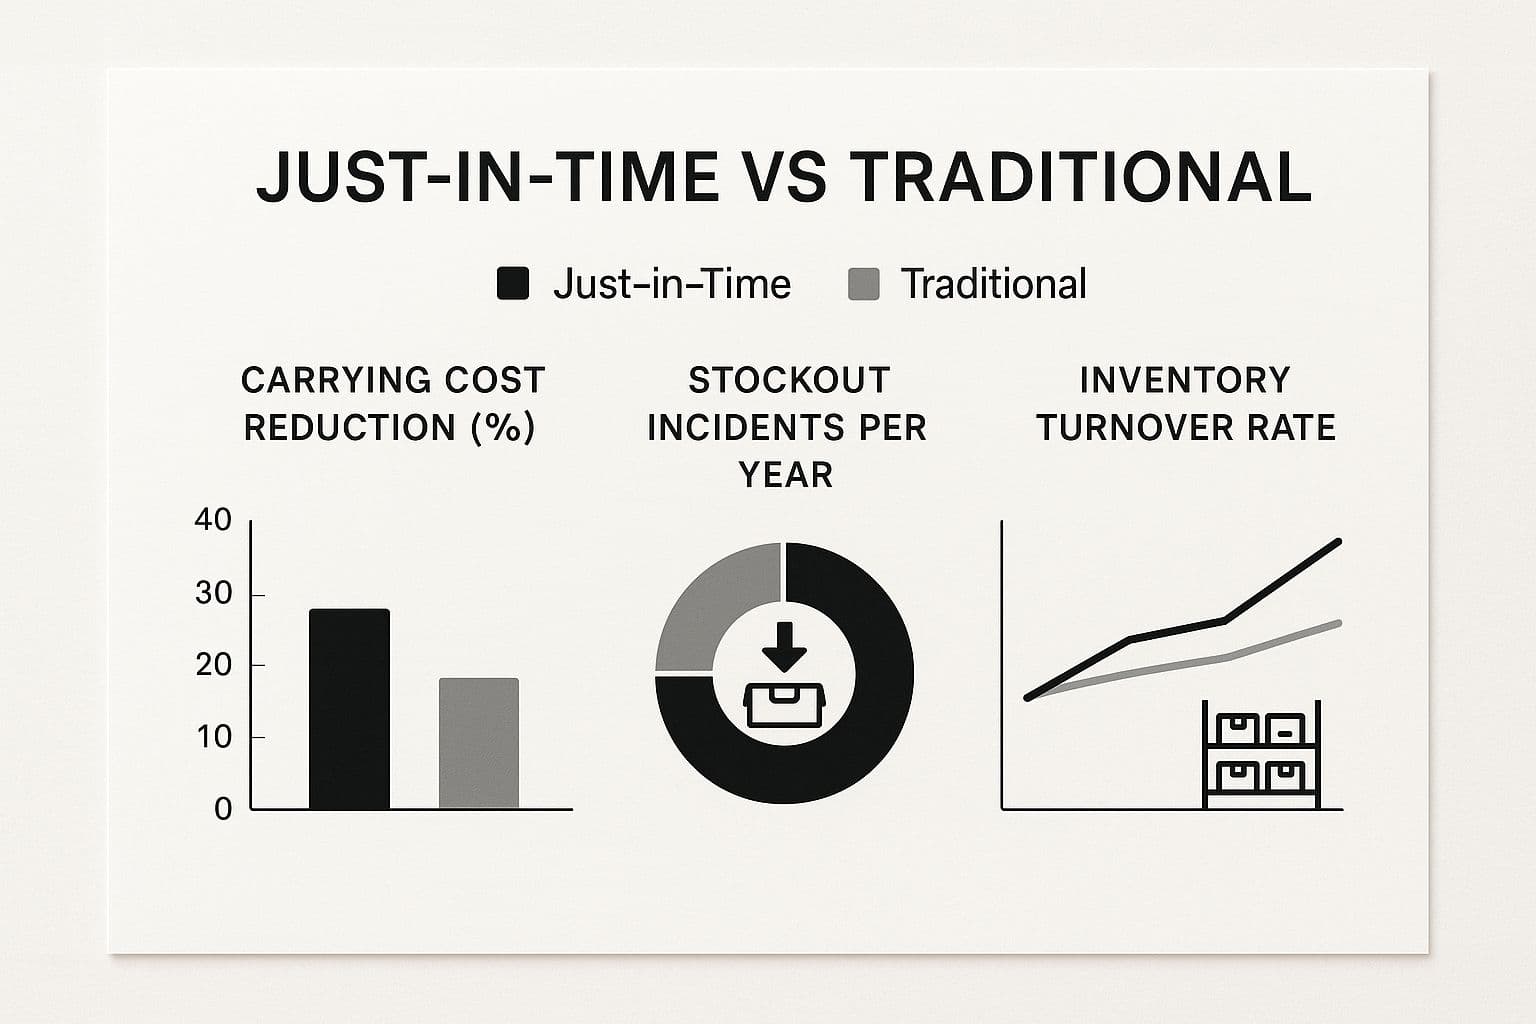
- Consider just-in-time (JIT) where feasible, understanding its coordination demands.
3) Warehousing: the operational hub
Warehousing costs are more than rent: labor, utilities, equipment, layout inefficiencies, and picking errors add up.
Improve flow by optimizing layout, investing in better picking systems, and removing manual data silos that cause mistakes and rework.
4) Technology & administration: the brain
Technology enables savings across the other drivers, but outdated or fragmented systems create silos and manual work. AI and analytics can deliver measurable reductions in logistics and inventory costs for adopters3.
Invest strategically in tools that deliver visibility and model scenarios before committing to big changes.
Strategic levers to lower costs
Once you know where costs live, pull the right levers. Optimization is a set of targeted moves, not a single huge overhaul.
- Focus on Total Cost of Ownership over purchase price alone.
- Use supplier collaboration and shared data to reduce the bullwhip effect.
- Rationalize inventory with ABC, safety-stock optimization, and targeted promotions for slow-moving stock.
- Optimize network design and sourcing to reduce transit time, tariffs, and freight spend.
Taming the bullwhip effect
Small demand changes can amplify upstream and create large swings in orders. Share POS and forecast data with suppliers to smooth production and inventory across the chain.
Inventory rationalization techniques
- ABC analysis: focus on A items for service and B/C items for efficiency.
- Safety stock optimization: calculate safety stock using demand variability and lead times instead of rules of thumb.
- JIT: lower carrying costs but requires precise coordination.
Network and sourcing optimization
Network optimization models help you decide on warehouse locations, consolidation, and nearshoring versus offshore sourcing. Strategic sourcing takes tariffs, transit risk, and lead-time variability into account. Recent trade disruptions and tariff changes continue to reshape sourcing strategies.
Small sourcing changes can cause big operational ripple effects. Model those scenarios before switching suppliers.
Strategic cost levers comparison
| Strategic Lever | Primary Focus | Potential Impact | Implementation Complexity |
|---|---|---|---|
| Network optimization | Logistics, facilities | High | High |
| Inventory rationalization | Holding costs, working capital | High | Medium |
| Supplier collaboration | Lead times, bullwhip | Medium-High | Medium |
| Strategic sourcing | Tariffs, material costs | High | High |
| Process improvement (JIT) | Production flow, holding costs | Medium-High | Medium-High |
Technology and AI for smarter control
Technology lets you move from reactive fixes to predictive operations. Modern, affordable tools are accessible to small and mid-size firms and help with demand forecasting, route optimization, predictive maintenance, and dynamic pricing.
Key use cases:
- Demand forecasting: AI blends historical sales, market signals, weather, and promotional calendars for better replenishment decisions.
- Predictive maintenance: avoid emergency truck repairs and avoidable delays.
- Route optimization: reduce fuel and labor costs while improving delivery reliability.
- Dynamic pricing: manage carrier cost volatility.
A range of cost-leading firms attribute significant savings to AI-enabled supply chain tools, especially for forecasting and inventory planning4.
Start small with accessible tools
You don’t need a multi-million dollar ERP to get value. Target one pain point with a specialist tool:
- Compare carrier rates with a shipping calculator like the Logistics Shipping Cost Predictor.
- Run a stock cost estimation using the Warren Buffett Stock Value Estimator to quantify the true cost of idle stock.
- Use the Manufacturing Production Time Estimator to model realistic lead times.
These micro-projects deliver quick ROI and build momentum for larger initiatives.
From theory to action: practical examples (MicroEstimates)
MicroEstimates offers free calculators that turn abstract principles into measurable savings.
Example 1: Shipping savings for a small e-commerce business
Scenario: 100 packages/month; switching carrier for heavy cross-country packages saves $4/package.
- Monthly savings: 100 × $4 = $400
- Annual savings: $4,800
Five minutes with a shipping calculator turns a hunch into hard savings.
Example 2: True cost of inventory for a mid-size manufacturer
Scenario: Carrying cost = 25%; 20% of oldest stock valued at $200,000.
- Annual carrying cost of that 20% slow stock: $200,000 × 25% × 20% = $10,000.
Using the Warren Buffett Stock Value Estimator shows how much capital sits idle and justifies promotions or liquidation to free cash and cut holding costs.
Build your optimization action plan
Turn insights into results with a stepwise plan: identify, prioritize, pilot, scale.
- Identify and map cost drivers across transportation, inventory, warehousing, and tech.
- Prioritize opportunities using a value vs. effort matrix (quick wins first).
- Implement a small pilot with clear metrics and timelines (30–60 days).
- Measure, refine, and scale successful pilots.
Pilot checklist
- Define success metrics (for example, 15% freight reduction on a lane).
- Set a 30–60 day timeline.
- Track and report results to build the case for rollout.
FAQs
Q: I run a small business. Where do I start?
A: Start with transportation and inventory. Audit shipping bills and run a quick ABC analysis to reveal cash-draining SKUs.
Q: Isn’t supply chain tech only for big companies?
A: No. Cloud tools and targeted calculators make high-impact analytics affordable for small and mid-size firms. Start with a single tool that fixes one pain point.
Q: How can I cut costs without hurting customers?
A: Focus on removing waste, not service. Route optimization, better carrier selection, and smarter inventory all tend to improve delivery speed and reduce stockouts.
Q: How often should I check costs?
A: Make quarterly high-level reviews, a deep annual analysis, and monthly or weekly checks for rapidly changing items like carrier rates.
Quick Q&A
Q: What provides the fastest wins for lean teams?
A: Audit carrier rates and run an ABC analysis. Those two moves often deliver measurable savings within 30–60 days.
Q: How do I justify buying new tools?
A: Run a small pilot with clear ROI metrics. If a tool reduces freight or holding costs by a defined percent, roll it out.
Q: What should I measure to prove success?
A: Track freight cost per unit, inventory days of supply, stockouts, and order lead time. Show changes against your baseline within the pilot window.
Supply Chain Tech | Network Optimization | Case Studies
Concise Q&A (3 items)
Q: What are the first three actions to cut supply chain costs?
A: Audit carrier rates, run an ABC analysis, and pilot a route or inventory tool for a single lane or SKU group.
Q: How quickly will I see savings from a pilot?
A: Many pilots show measurable results in 30–60 days for freight and 60–90 days for inventory adjustments.
Q: When should I move from pilot to scale?
A: Scale when metrics meet or exceed your success criteria and processes are documented to repeat the result.
1.
Council of Supply Chain Management Professionals, State of Logistics and industry summaries. See https://cscmp.org
2.
Investopedia, “Carrying Costs,” overview of inventory carrying cost components and typical ranges. See https://www.investopedia.com/terms/c/carrying-costs.asp
3.
BCG and industry analyses on AI in supply chains showing efficiency gains in logistics and inventory management. See https://www.bcg.com
4.
McKinsey insights on digital supply chains and the value of analytics for cost reduction and resilience. See https://www.mckinsey.com
Ready to Build Your Own Tools for Free?
Join hundreds of businesses already using custom estimation tools to increase profits and win more clients
✨ No coding required • 🚀 Ready in minutes • 💸 Free to create